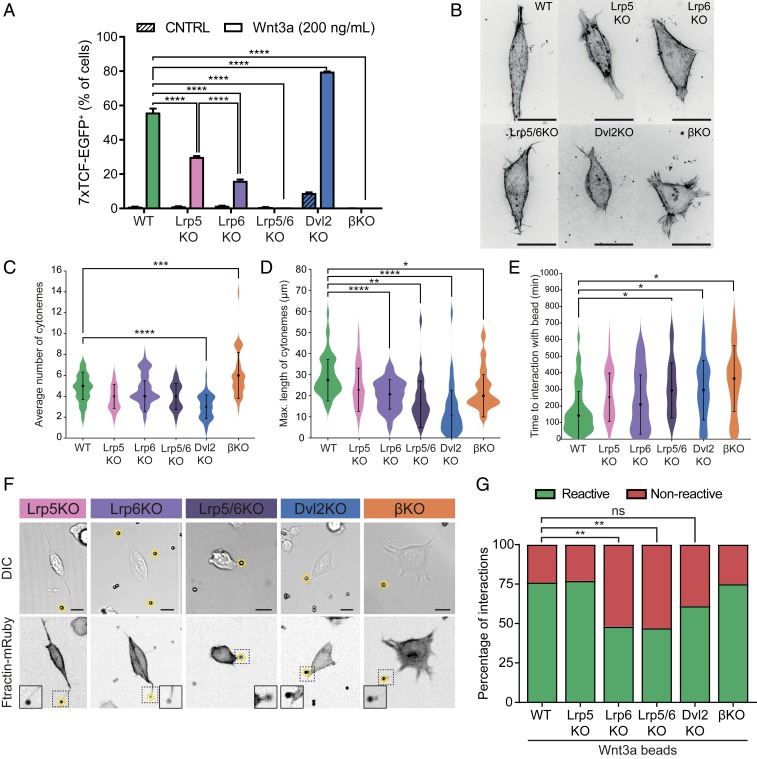
Fig. 4.
Components of the Wnt-pathway regulate the formation and dynamics of the cytonemes of ESCs. (A) Response of the 7xTCF-eGFP Wnt/β-catenin pathway reporter in WT, LRP5KO, LRP6KO, LRP5/6KO, DVL2KO, and βKO treated with media containing either 200 ng mL−1 soluble Wnt3a or vehicle for 24 h, as measured by fluorescent activated cell sorting (FACS) flow cytometry profile. Asterisks indicate statistical significance as calculated by two-way ANOVA test. (B) Representative deconvolved structural illumination microscopy images of WT and KO ESCs stained with live-cell cytoskeleton staining reagent SiR-Actin. (Scale bar, 20 μm.) (C and D) Violin plots of the distribution and average number of cytonemes per cell (C) and the distribution and average maximum length of a cytoneme per cell normalized to the average cell radius (D) for WT and KO ESCs. (E) Violin plots of the distribution and average time necessary for bead contact in WT or KO ESCs. For C–E, n > 40 cells from three independent experiments. Asterisks indicate statistical significance calculated by one-way ANOVA tests. For detailed statistical analysis, see SI Appendix, Fig. S8 B–D. (F) Representative images of the different KO ESC lines, stably expressing the F-actin reporter Ftractin-mRuby and contacting Wnt3a beads with a nano-cytoneme. Wnt3a beads are indicated by yellow dashed circles. (Scale bars, 10 μm.) (G) Quantification of reactive (green) or nonreactive (red) interactions between WT or KO ESCs and Wnt3a beads. n ≥ 39 from three independent experiments. Asterisks indicate statistical significance calculated by Fisher’s exact test. For all panels, asterisks indicate statistical significance as: ns, not significant; *P < 0.05; **P < 0.01; ***P < 0.001; ****P < 0.0001.

