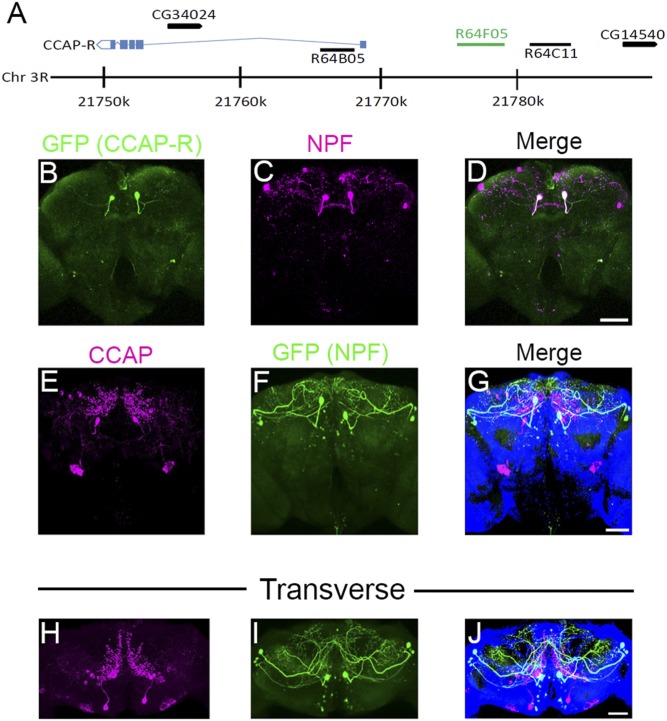
Fig. 1.
Branches of CCAP neurons superimpose NPF neuron cell bodies. (A) Structure of the Drosophila CCAP-R genomic region; blue boxes indicate CCAP-R exons and blue lines indicate introns. Black arrows with corresponding CG numbers above indicate other genes in the region. Sequences cloned to drive GAL4 expression are indicated as black lines with the corresponding FlyLight number above. The genomic sequence used for R64F05-GAL4 is indicated as a green line. (B–D) Dissected R64F05-GAL4;UAS-GFP male adult brains (5 to 9 d posteclosion) were costained with (B) anti-GFP (green) and (C) anti-NPF (magenta). (D) White in the merged picture indicates overlapping GFP (R64F05) and NPF expression. (Scale bar, 50 µm.) Pictures show a representative Z stack, which includes 40 (2-µm) slices. (E–G) Z projection of (E) CCAP (magenta) and (F) GFP (green; NPF-GAL4;UAS-GFP) neurons in dissected male adult brains (10 to 12 d posteclosion). (G) Merged picture showing CCAP (magenta) and GFP (green; NPF) expression. (Scale bar, 50 µm.) The picture is representative of a Z stack, which includes 40 (2-μm) slices. (H–J) Transverse Z projection of (H) CCAP (magenta) and (I) GFP (green; NPF-GAL4;UAS-GFP) neurons in dissected male adult brains (10 to 12 d posteclosion). (J) Merged picture showing CCAP (magenta) and GFP (green; NPF) expression. (Scale bar, 50 µm.)

