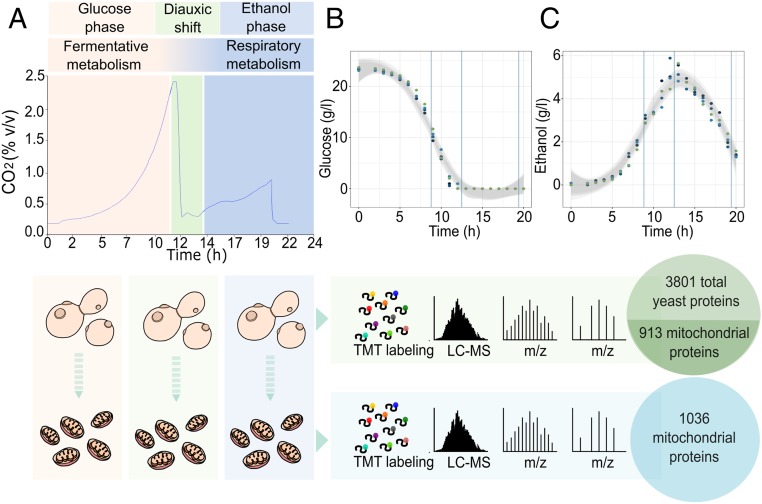
Fig. 1.
Overview of the experimental design. (A) The experimental workflow showing the CO2 profile of yeast grown in controlled batch cultivation. Cells and mitochondria samples were then digested with trypsin, and the resulting peptide samples were labeled with isobaric TMT mass tags and analyzed using an Orbitrap Fusion Tribrid mass spectrometer. (B and C) Extracellular glucose and ethanol concentrations were measured at intervals of 2 h throughout the experiment. Shaded areas represent the 95% confidence intervals for each curve, with vertical lines corresponding to the time chosen for the yeast cell harvesting and mitochondrial isolation (number of biological replicates: 4). LC-MS: liquid chromatography–mass spectrometry; m/z: mass-to-charge ratio.

