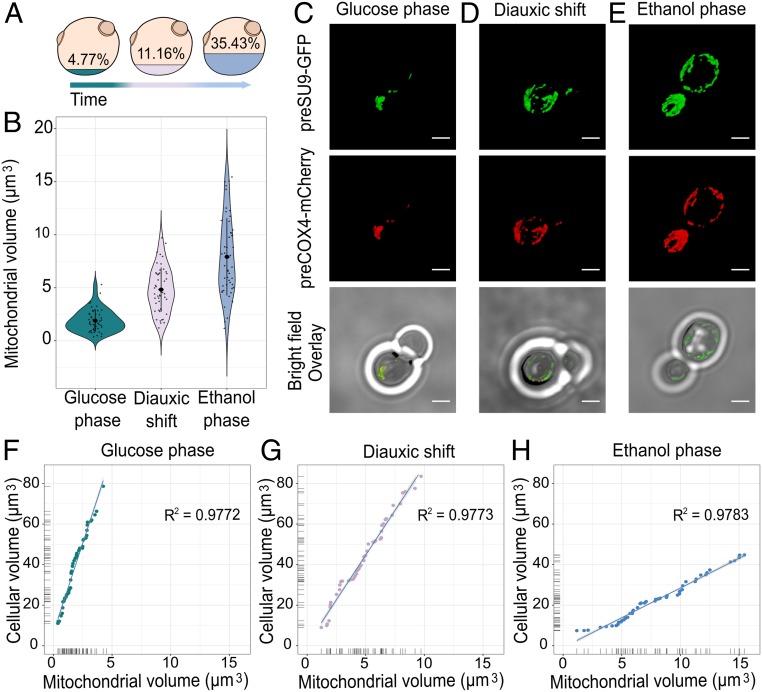
Fig. 2.
Tracking mitochondrial volume during cell growth. (A) Representation of the cellular volume (cubic microns) occupied by the mitochondrial network during the different stages of growth. (B) Mitochondrial volume variation during glucose phase, diauxic shift, and ethanol phase (n = 50 cells per condition). (C–E) Mitochondrial network morphology of yeast cells as determined by confocal microscopy. Cells are expressing the mitochondrial membrane potential (MMP)-dependent and MMP-independent preCOX4-mCherry and preSU9-GFP (“MitoLoc”), which are imported into the mitochondria in the different growth stages. (Scale bar, 2 µm.) (F–H) Correlation of cell volume-to-mitochondrial volume during the three growth stages (n = 50 cells per condition, with samples including budding and nonbudding cells).

