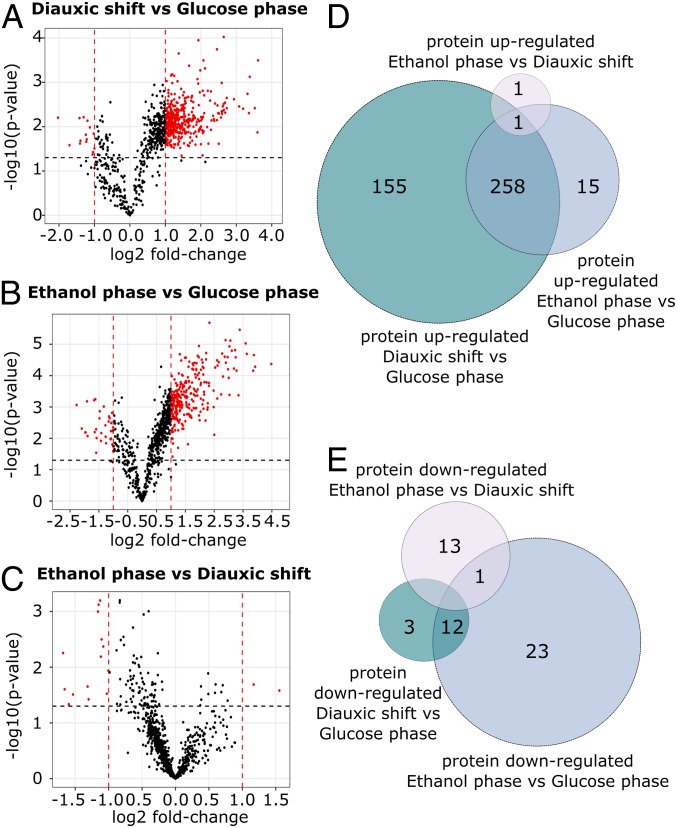
Fig. 3.
Differentially expressed proteins in the three metabolic phases of yeast growth. (A–C) Volcano plots showing differentially expressed proteins identified through the comparison of the three metabolic phases of yeast growth. Log-transformed P values (t test) are plotted against log-transformed fold change. The horizontal dashed line marks a P value of 0.05. Vertical dashed lines indicate a log2 fold change of ±1. (D and E) Venn diagrams depicting the number of proteins specifically up-regulated and down-regulated identified through comparison of the differentially expressed protein in the three phases of yeast growth. The specific identifications are reported in Dataset S4.

