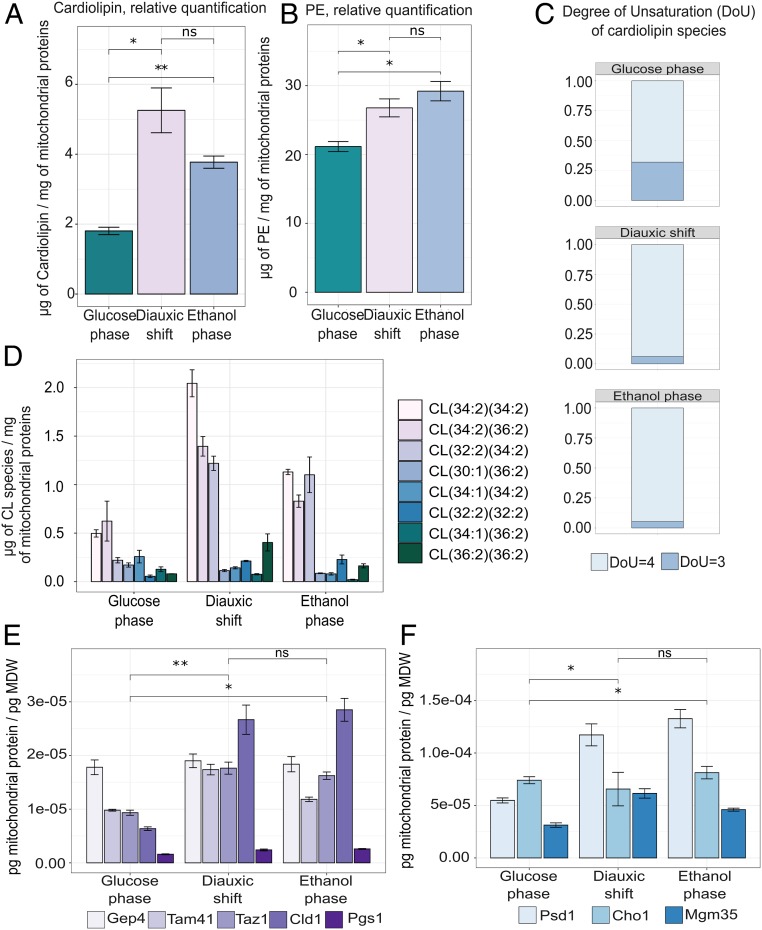
Fig. 5.
The changing abundance and unsaturation of CL as cells progress to respiratory postdiauxic growth. (A) Abundance of CL scaled to picogram of mitochondrial dry weight (MDW), calculated as the mean ± SD of three biological replicates, based on liquid chromatography–mass spectrometry (LC-MS) analysis of isolated mitochondria. Statistical analyses were performed using paired t test. (B) Degree of unsaturation of the CL moieties, calculated as (2C + 2 + N − X − H)/2, where C is the number of carbon atoms, N is the number of nitrogen atoms, X is the number of halogen atoms (F, Cl, Br, I), and H is the number of hydrogen atoms. (C) Distribution of CL species with different acyl-chain composition, obtained from LC-MS analysis of lipids from mitochondria isolated in the different stage of growth. Data were calculated as the means of three biological replicates. Individual CL species are represented by different bar fill colors. (D) Absolute abundance of the identified enzymes involved in CL biosynthesis and CL modifying the acyl-chain composition of CL, Gep4, Tam41, Taz1, Cld1, and Pgs1 in the three stages of growth. Data represent the means ± SD of three biological replicates. Statistical analyses were performed using paired t test. (E) Abundance of PE scaled to picogram of MDW, calculated as the mean ± SD of three biological replicates, based on LC-MS analysis of isolated mitochondria. Statistical analyses were performed using paired t test. (F) Absolute abundance of the identified enzymes involved in PE metabolism, Psd1, Cho1, and Mgm35, in the three stages of growth. Data represent the means ± SD of three biological replicates. Statistical analyses were performed using paired t test. All absolute abundances are scaled to picogram of MDW. Statistical analyses were performed using paired t test. Statistically significant differences are indicated as follows: ns (not significant), P > 0.05; *P < 0.05; **P < 0.01.

