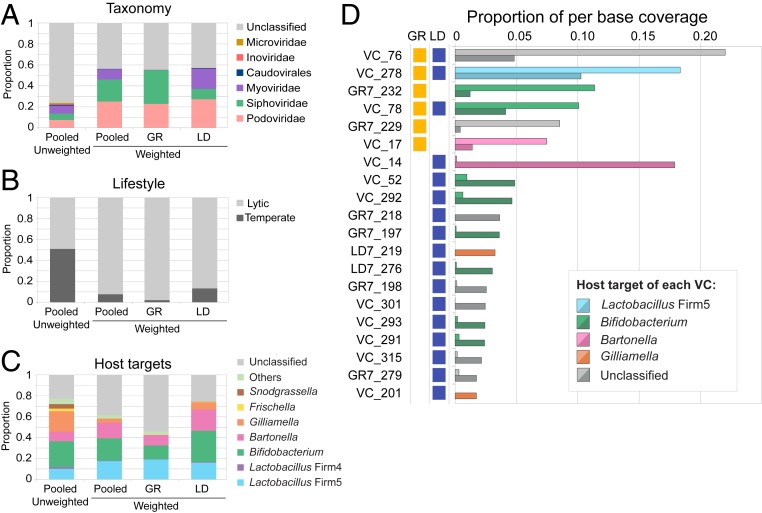
Fig. 2.
Characterization of the VCs identified in the two viral metagenomes. (A) Proportion of VCs per taxonomic annotation at family level. (B) Proportions of VCs predicted to have a temperate or lytic lifestyle. (C) Proportion of VCs per predicted bacterial target. “GR” and “LD” indicate the relative proportions in each viral metagenome. “Pooled” depicts the proportions across both viral metagenomes. “Unweighted” shows raw counts based on the de novo assembly, while “Weighted” shows counts normalized per base coverage and hence indicates the relative abundances in the phage samples. (D) Blue and orange boxes indicate which VCs contribute to >75% of the relative abundances in each viral metagenome (six VCs for sample GR and 17 VCs for sample LD, 20 VCs in total). The relative abundance of these 20 VCs in each sample is given next to it (Upper bar for GR, Lower bar for LD). Relative abundances were calculated based on coverage per base per contig in each VC.

