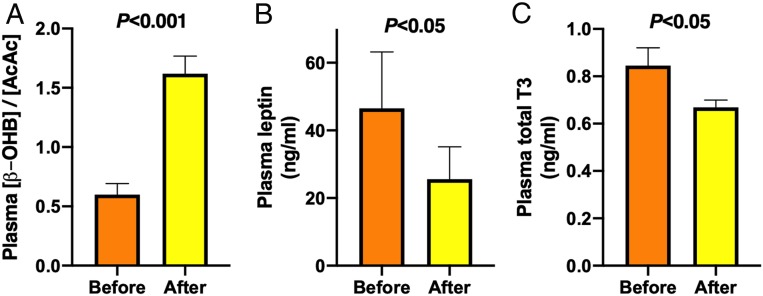
Fig. 6.
Potential mechanisms underlying the reduction in VCS. (A) Ratio of plasma β-OHB and AcAc concentrations, which reflect mitochondrial redox state, (B) plasma leptin concentrations, and (C) plasma total T3 concentrations before (orange bars) and after (yellow bars) the 6-d KD (n = 10). Data are shown as mean ± SEM. P values were determined using paired Student’s t tests.

