
Figure 2:
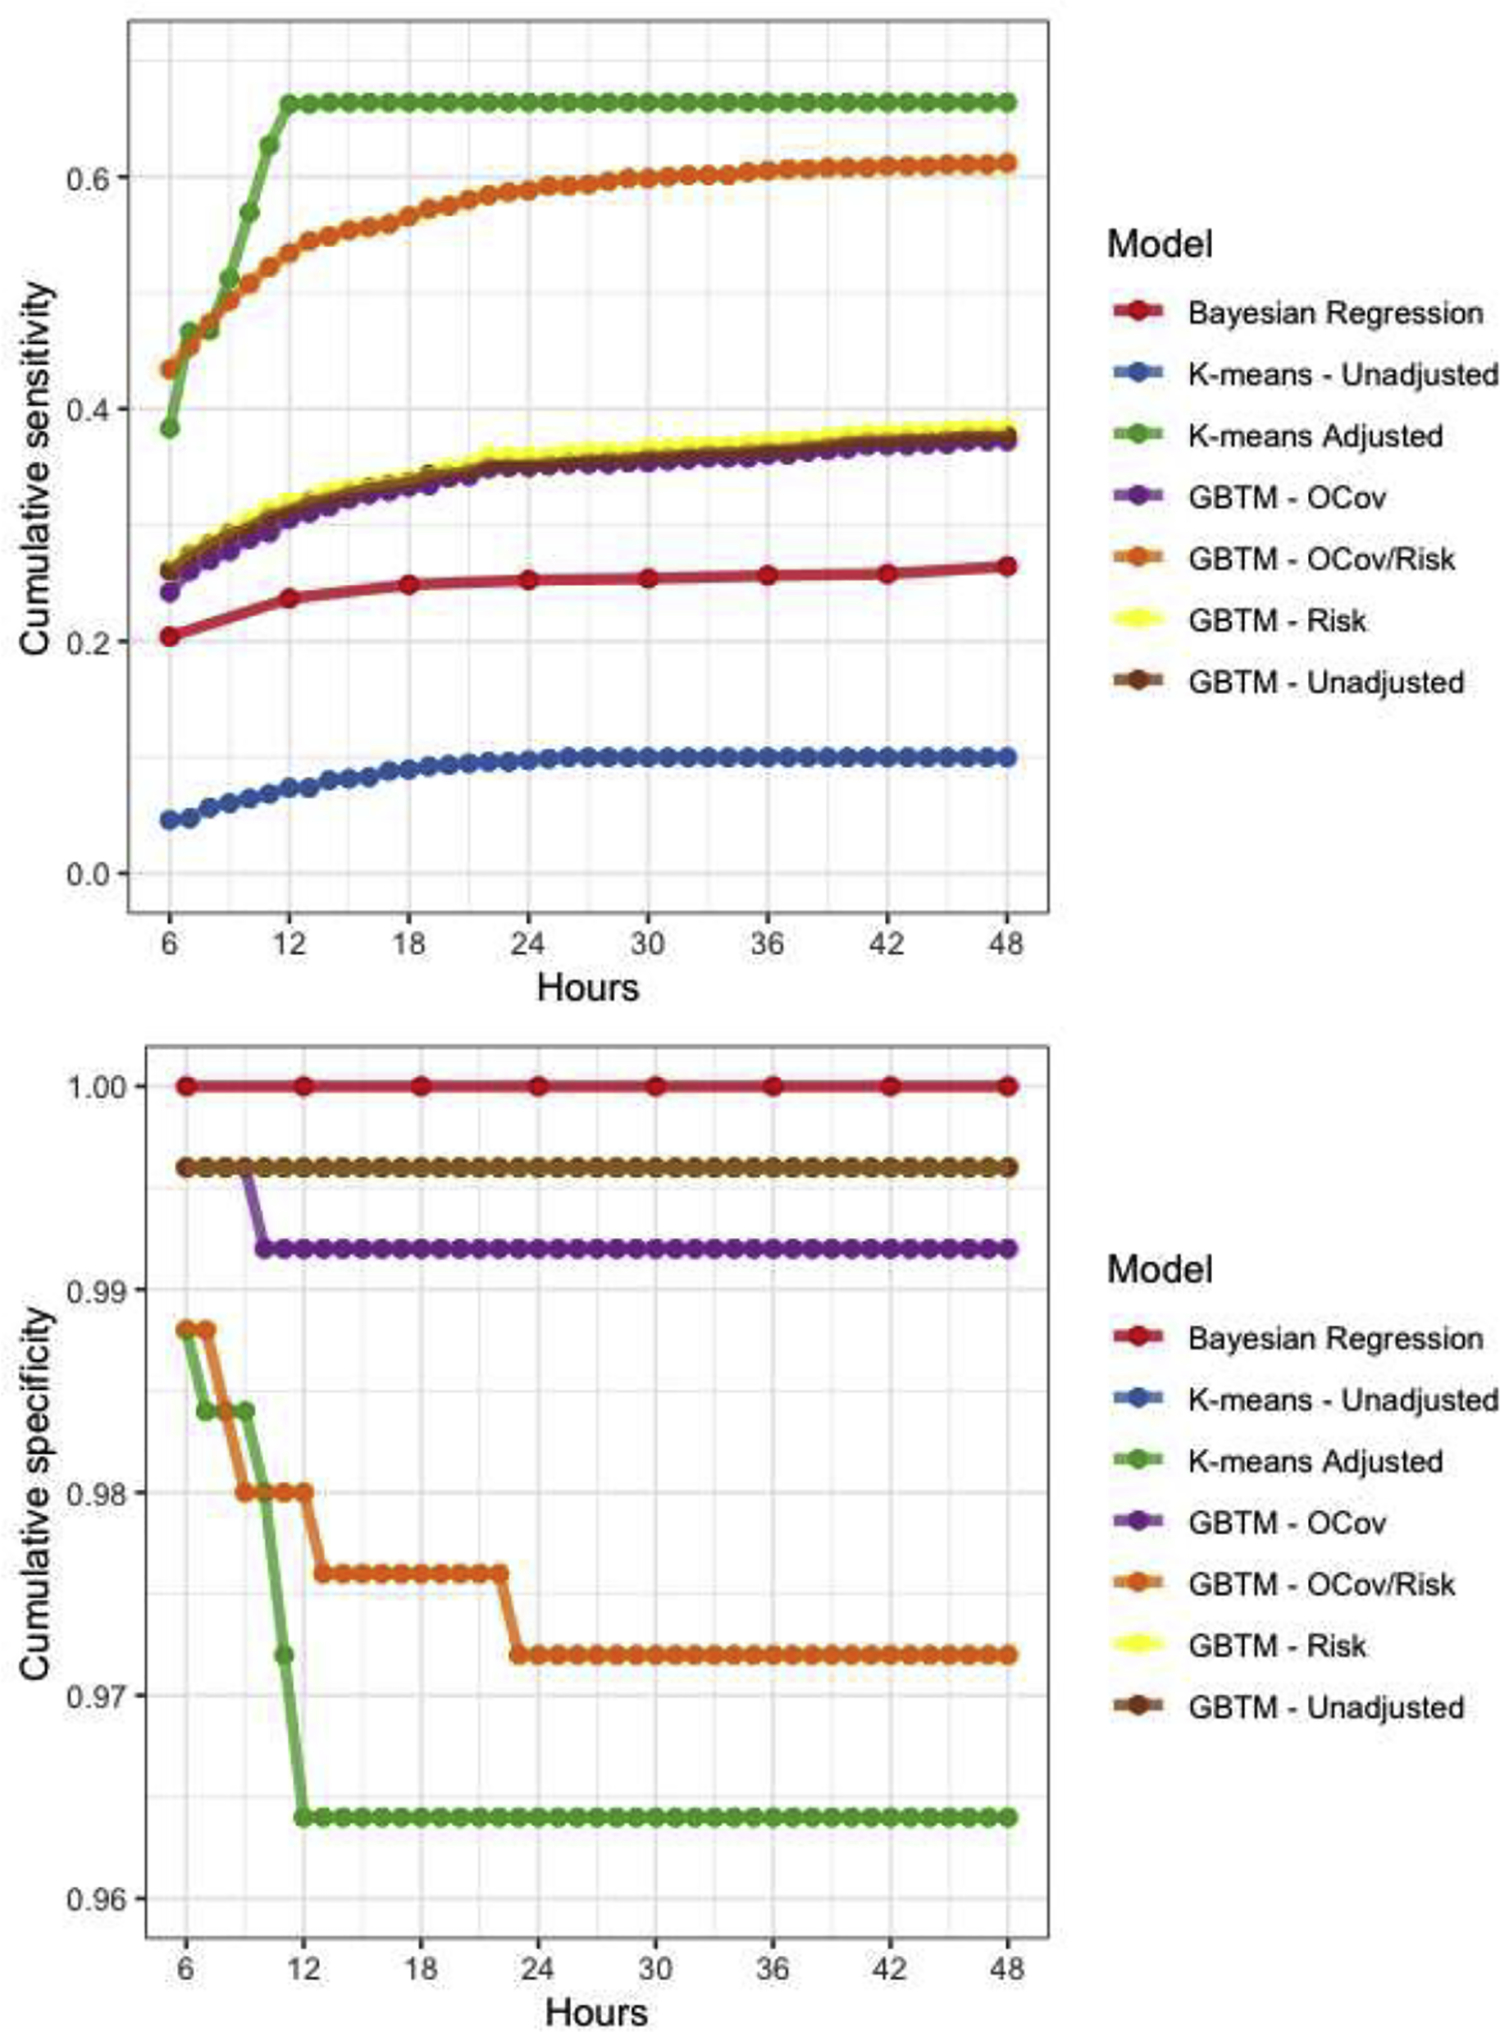
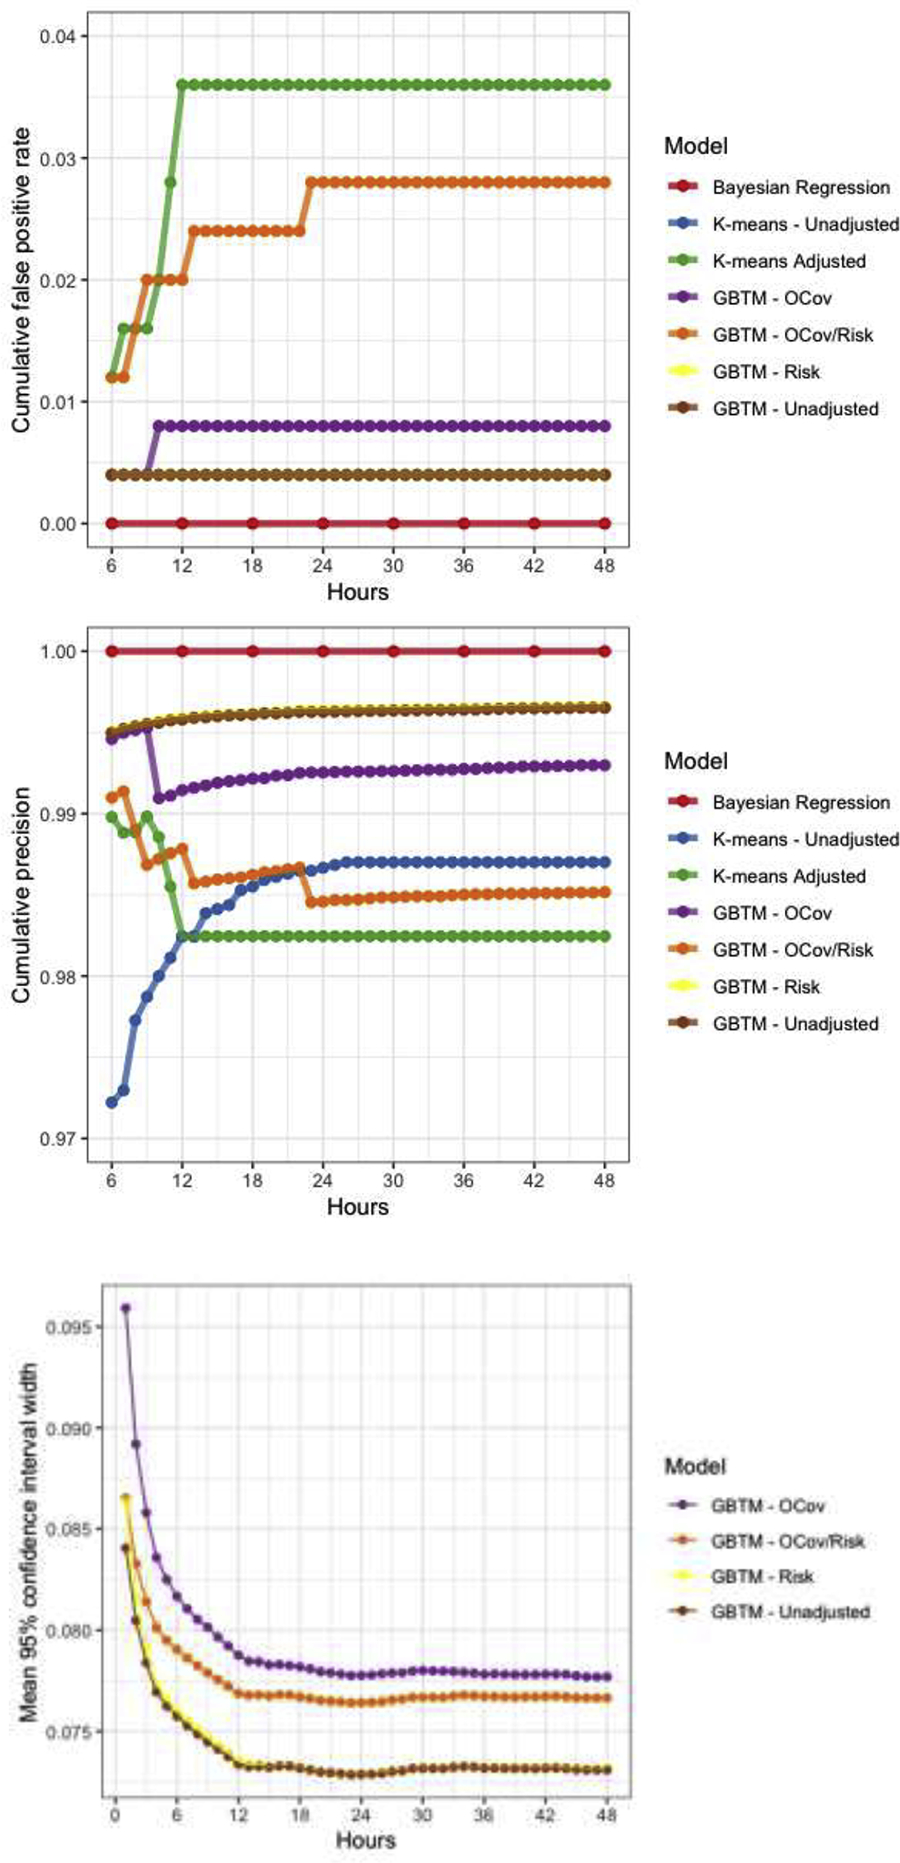
Model performance characteristics over time. Note, sensitivities (A) and false positive rates (B) for three GBTMs (unadjusted, outcome covariates (OCov) and risk factors (Risk) were nearly identical so are partially obscured by overplotting.