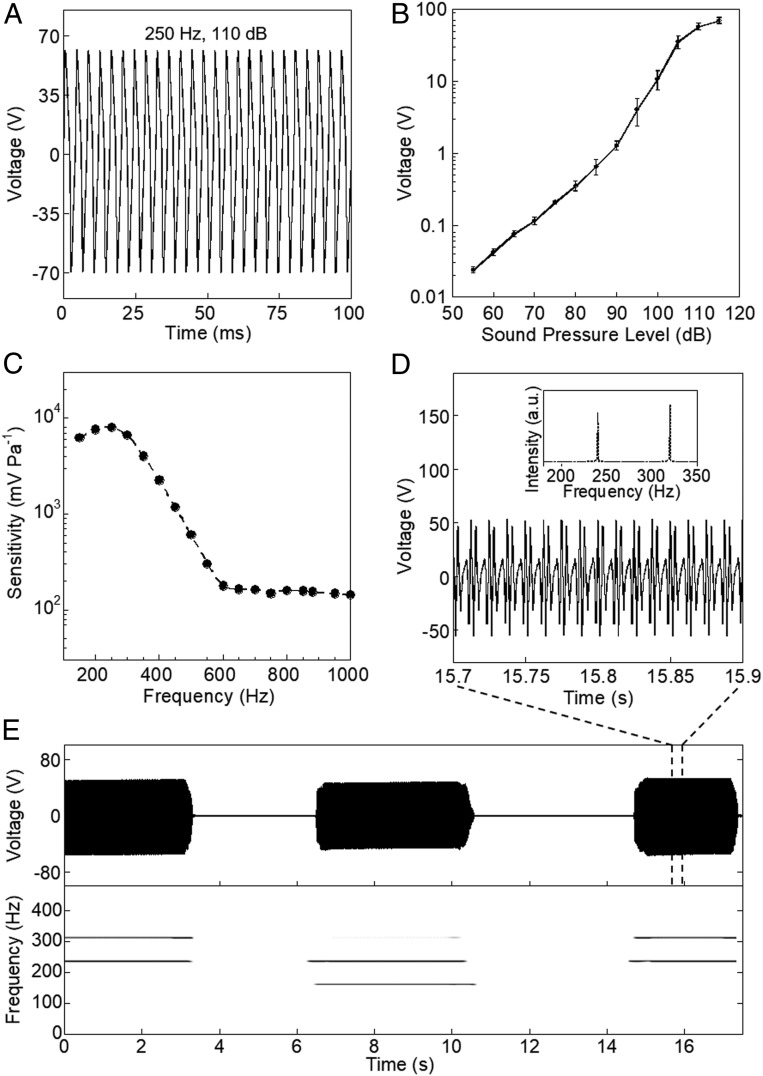
Fig. 2.
Acoustic performance of the all-nanofiber mechanoacoustic sensor (A) Voltage waveform generated when a sound wave of constant frequency (250 Hz) and 110-dB SPL is applied to the sensor. The sensing area is 2.5 × 2.5 cm2. (B) Effect of the SPL on the sensor performance (n = 3). (C) Frequency response of the sensor. (D) Bifrequency (240 and 320 Hz) detection when sound waves with two different frequencies are simultaneously applied to the sensor (Inset) Corresponding FFT of the two frequencies. (E) Sensor performance when sound waves with two different frequencies are simultaneously applied, and the corresponding spectrogram. The two different sound waves were simultaneously applied to the sensor in the following manner: 240 and 320 Hz (0–3.4 s), 160 and 240 Hz (6.5–10.5 s), and 240 and 320 Hz (14.5–17.3 s).

