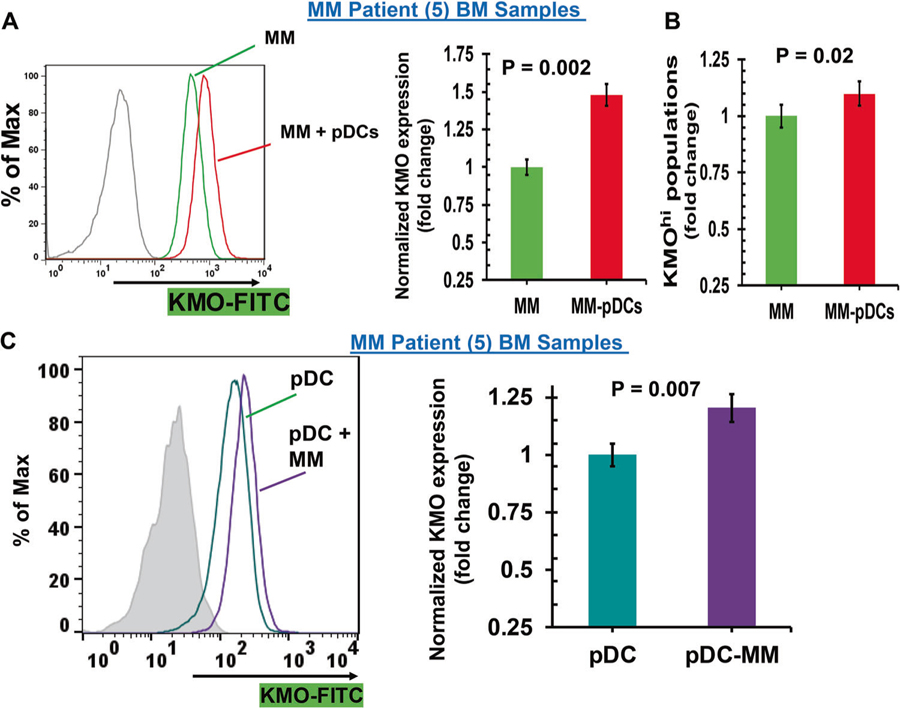
Fig. 2.
Modulation of KMO expression during pDC–MM cell interactions (a) pDCs were cocultured with autologous patient MM cells for 24 h, followed by multicolor flow analyses to assess the pDC-induced change in KMO expression on MM cells. CD138+ MM cells were examined using flow cytometry, and median fluorescence intensity (MFI) of KMO expression was determined using anti-KMO Ab conjugated to FITC, both in the presence or absence of pDCs. Left panel: representative histograms shows KMO expression in MM cells cultured in the presence (red) and absence (green) of pDCs. [Black histogram: isotype control Ab]. Right panel: normalized KMO expression in MM cells cultured in the presence and absence of pDCs. Data was quantified from the histogram analyses shown in the left panel (mean ± SD; p < 0.05; data obtained from analysis of five MM patient BM samples). b pDCs were cocultured with autologous patient MM cells for 24 h, followed by multicolor flow analysis to determine the pDC-induced change in the KMOhi MM cell population [mean ± SD; p < 0.05; data obtained from five MM patient BM samples]. c MM patient BM-pDCs were cocultured with autologous MM cells for 24 h, followed by multicolor flow analyses to determine change in KMO expression on pDCs. pDCs (CD304/CD123/CD303+) were examined by flow analysis, and median fluorescence intensity (MFI) was determined for KMO expression on pDCs, using anti-KMO-FITC Ab, both in the presence or absence of MM cells. Left panel: representative histograms shows KMO expression in MM–BM–pDCs cultured in the presence (violet) and absence (blue–green) of MM cells. [Shaded black histogram: isotype control Ab]. Right panel: normalized KMO expression in MM-patient pDCs cultured in the presence or absence of patient MM cells. Data was quantified from the histogram analyses shown in the left panel (mean ± SD; p < 0.05; data obtained from five MM patient BM samples)

