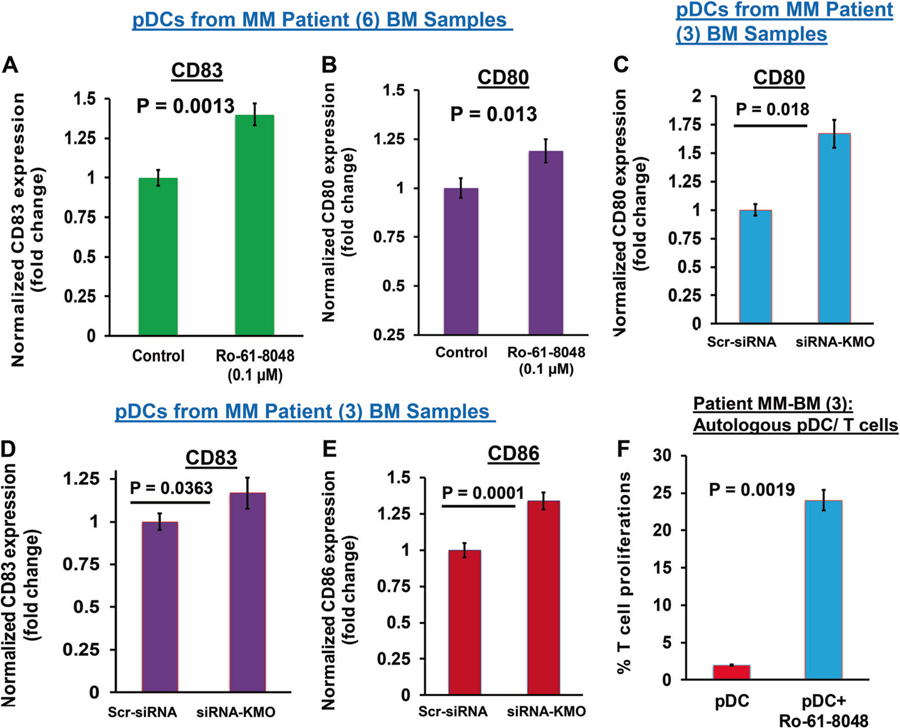
Fig. 3.
KMO blockade activates pDCs and enhances pDC-triggered T cell proliferation (a, b) MM patient pDCs were treated with Ro-61–8048 (100 nM) for 24 h, followed by multicolor staining and flow cytometric analysis of pDC activation/maturation markers CD83 and CD80. Fold change in Ro-61–8048-treated versus untreated is presented (mean ± SD; p < 0.05; Data obtained from six MM patient samples). c–e MM patient pDCs were transfected with KMO-siRNA using TransIT-X2 transfection reagent as per manufacturer’s protocol (Mirus Bio, USA). The KMO-siRNA-transfected pDCs were cultured in complete DCP medium for 48 h, and then stained with fluorophore-conjugated Abs against CD80, CD83, and CD86, followed by flow cytometry analysis. Bar graph: quantification of MFI for each marker, and data is shown as fold change between scr-siRNA- versus KMO-siRNA-transfected pDCs. Analysis was performed using three MM patient samples (mean ± SD; CD80: p = 0.018; CD83: p = 0.0363; CD86: p = 0.0001). Student’s t test was utilized to derive statistical significance. The minimal level of significance was p < 0.05 (GraphPad PRISM version 6, La Jolla, California, USA). f pDCs from MM patients were cocultured with autologous T cells at 1:10 (pDC:T) ratio in the presence or absence of Ro 61–8048 (100 nM) for 3 days, and viable CD8+ T cells were quantified using CellTrace Violet-Cell Proliferation Kit by FACS (mean ± SD; P < 0.05, three MM patient BM samples)

