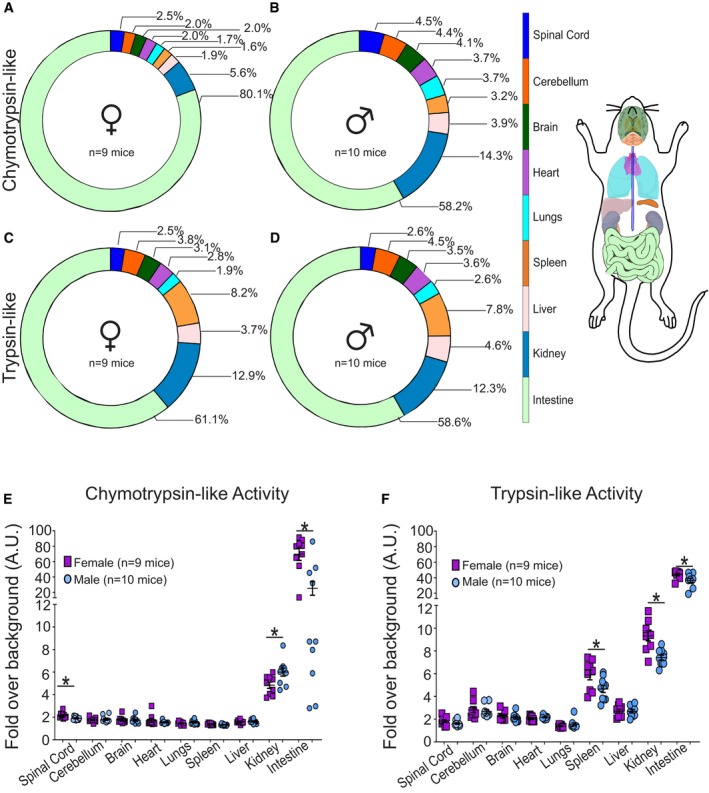
Figure 1. Organism‐wide proteasome activity mapping reveals sexual dimorphism in a number of tissues.

-
A–DProportional distribution of chymotrypsin‐like activity of the proteasome across nine tissues from female (n = 9) and male (n = 10) mice. Proportional distribution of trypsin‐like activity of the proteasome across nine tissues from female (n = 9) and male (n = 10) mice. Graphical representation of color code of tissues is analyzed.
-
E, FChymotrypsin‐like or trypsin‐like activity of the proteasome across nine tissues in individual mice. Each data point (n = 9 females and n = 10 males) indicates data from a single mouse performed in triplicate. Each central line and error bar indicate mean ± SEM. *P < 0.05 by unpaired two‐tailed Student's t‐test comparing male and female samples.
