-
A
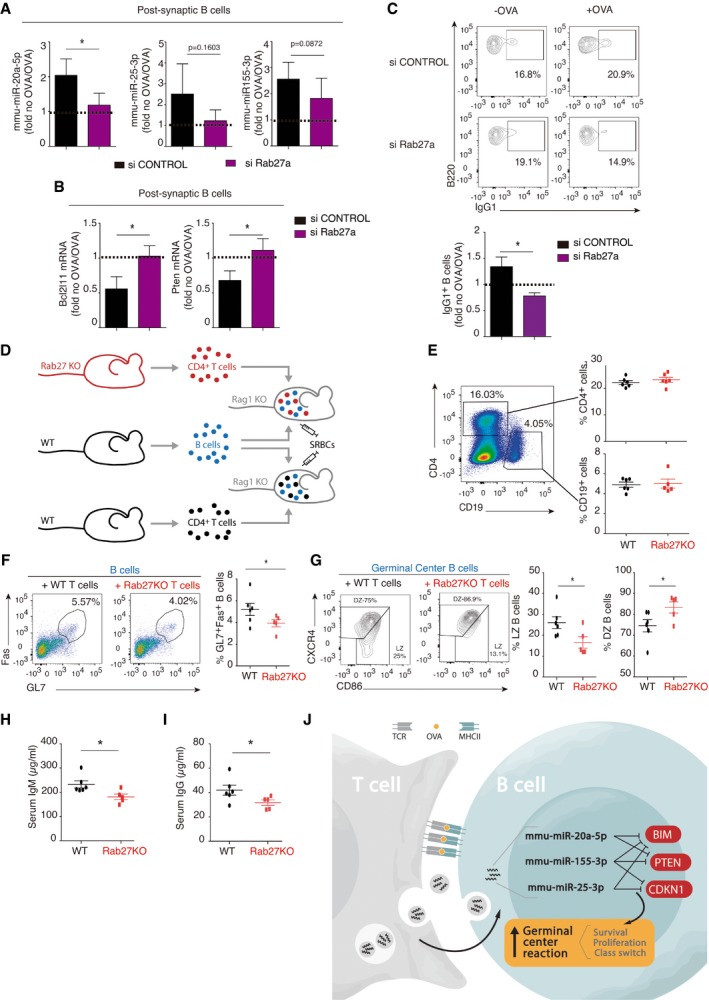
Quantitative real‐time PCR (RNU1A1 and RNU5G‐normalized) showing blockade of miRNA transfer from CD4+ T cells pre‐treated with siRNA targeting the exosome secretion mediator Rab27. Bar charts represent the mean values ± SEM of at least four independent experiments.
-
B
Quantitative real‐time PCR showing mRNA target down‐modulation after IS formation between DICER‐KO B cells and CD4+ T cells nucleofected with either siRab27 or scrambled control siRNA, with normalization to GAPDH. Bar charts represent the mean values ± SEM of at least four independent experiments.
-
C
Representative dot‐plots, showing IgG1 expression of gated B220+ B cells after IS formation as in (G); the bar chart shows the mean fluorescence Intensity ± SEM and quantification of three independent experiments is shown.
-
D
Experimental design. Rag1KO mice were adoptively transferred with WT B lymphocytes and either Rab27‐KO T cells (top) or WT T cells. Thereafter mice were inoculated with sheep red blood cells, and spleens and serum were harvested after 7 days.
-
E
Representative plot (left) and quantification (right) of the reconstitution of the B‐cell and T‐cell compartments after adoptive transfer. The graph shows the mean percentage of CD19‐ and CD4‐positive cells from n ≥ 5 reconstituted mice ± SEM.
-
F
Representative flow cytometry plot (left) and quantification (right) of GL7 and CD95/Fas expression in B cells. The graph shows the mean percentage of GL7+Fas+ cells from n ≥ 5 reconstituted mice ± SEM.
-
G
Representative dot‐plot analysis showing CXCR4 and CD86 expression on B cells for dark zone (DZ) and light zone (LZ) analysis (gated on GC GL7+ Fas+ B cells). The graph shows the mean percentage of DZ (CXCR4+CD86−) and LZ (CXCR4−CD86+) populations from n ≥ 5 reconstituted mice ± SEM.
-
H, I
ELISA quantification of IgM (H) and IgG (I) in serum from immunized adoptively transferred mice. The graph shows the mean serum concentration of IgM and IgG from n ≥ 5 reconstituted mice, respectively ± SEM.
-
J
Proposed model of exosomal miRNA transfer during cognate B‐ and T‐cell interactions.
< 0.05.

