-
A
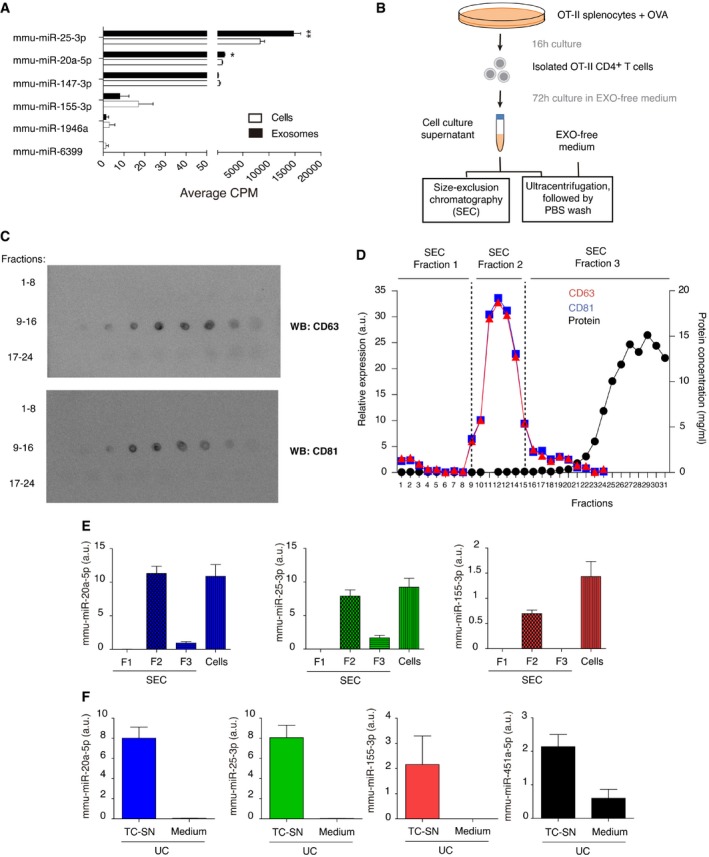
Mean counts per million (CPM) analyzed by small RNA NGS of the 6 differentially expressed miRNAs after IS formation in cell and EV fractions of mouse lymphoblast cultures. Bar charts show the mean of three independent experiments ± SEM. Significance was assessed by unpaired Student's t test comparing the exosomal and cellular miRNA content; *P < 0.05, **P < 0.01.
-
B
Schematic representation of the two protocols used for small EV isolation.
-
C
Dot plot of size‐exclusion chromatography fractions with anti‐CD63 and anti‐CD81 antibodies.
-
D
Representation of the different fractions relative expression of CD63 and CD81, assessed by Image Gauge software analysis of dot‐plots, and protein concentration measured by Nanodrop. SEC fractions 1, 2, and 3 were pooled and ultracentrifuged at 100,000 g for miRNA content analysis by qPCR.
-
E
Quantitative RT–PCR of mmu‐miR‐20a‐5p, mmu‐miR‐25‐3p, and mmu‐miR‐155‐3p expression in SEC fractions and secreting cells, normalized to UniSp6 spike‐in. Bar charts show the mean ± SEM of a representative experiment from two independent experiments performed.
-
F
Quantitative RT–PCR showing miRNA levels in medium and OT‐II CD4+ T cell‐derived small EVs obtained by ultracentrifugation, normalized to UniSp6 spike‐in. Bar charts show the mean ± SEM of a representative experiment from two independent experiments performed.

