
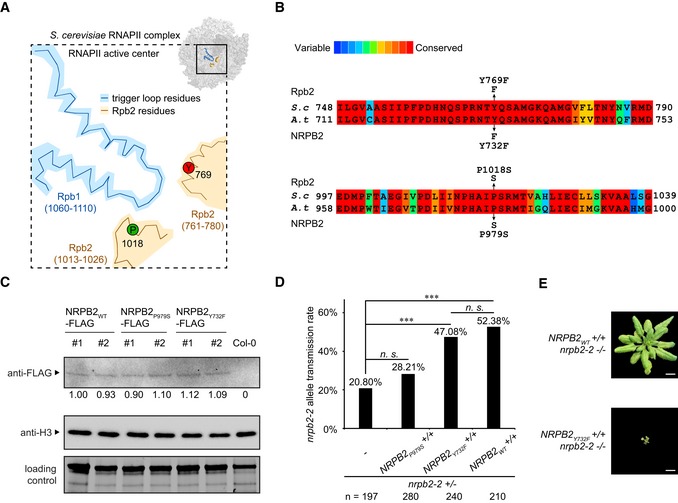
Figure 1. Altering transcription activity of RNAPII by targeted mutagenesis in NRPB2.
-
ASchematic drawing of Saccharomyces cerevisiae RNAPII transcription active center. Trigger loop is shown in blue. TL‐interacting Rpb2 domain is shown in beige. Proline 1018 (P1018, green) and gating tyrosine 769 (Y769, red) are highlighted. The schematic drawing is based on PDB: 2e2h 15.
-
BProtein sequence alignment of RNAPII Rpb2 Y769 and P1018 regions in S. cerevisiae and Arabidopsis thaliana. P979S and Y732F are the yeast equivalent point mutations in Arabidopsis. The color scheme indicates conservation from variable (blue) to conserved (red).
-
CDetection of NRPB2WT‐FLAG, NRPB2P979S‐FLAG, and NRPB2Y732F‐FLAG protein by Western blotting in NRPB2 WT ‐FLAG Col‐0, NRPB2 P979S ‐FLAG Col‐0, and NRPB2Y 732F ‐FLAG Col‐0 plants. Untagged NRPB2 (Col‐0) was used as a negative control. Histone H3 was used as an internal control, and total protein level detected by stain‐free blot was used as a loading control. Quantification was done by normalizing to the loading control and anti‐H3 blot based on three independent replicates.
-
DTransmission rate of nrpb2‐2 allele in nrpb2‐2 +/− line (n = 197) and nrpb2‐ +/− lines combined with homozygous NRPB2 P979S ‐FLAG +/+ (n = 280), NRPB2 Y732F ‐FLAG +/+ (n = 240), and NRPB2 WT ‐FLAG +/+ (n = 210), respectively. Fisher's exact test was used as a statistical test, three asterisks denote P < 0.001 between samples, and n.s. stands for not significant.
-
EImage of homozygous mutant nrpb2‐2 fully complemented by NRPB2 WT ‐FLAG (top, NRPB2 WT +/+ nrpb2‐2 −/−) and partially complemented by NRPB2 Y732F ‐FLAG (bottom, NRPB2 Y732F +/+ nrpb2‐2 −/−). Plants were grown for 4 weeks in soil. Scale bars represent 1 cm.
Source data are available online for this figure.