-
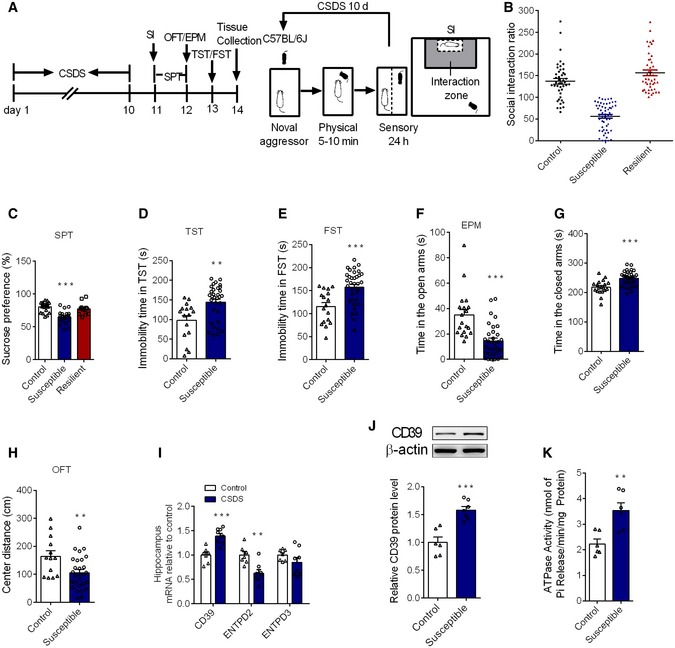
A
Time‐line of experiment procedures in the chronic social defeat stress.
-
B
Social interaction ratio in control, susceptible, and resilient mice following the CSDS protocol (n = 44, 55, 44 mice).
-
C
Sucrose preference in control, susceptible, and resilient mice (n = 20, 20, 12 mice; Treatment F
2,49 = 16.05, P < 0.0001, one‐way ANOVA with Fisher's LSD test).
-
D
The immobility time in TST in susceptible mice, compared to control mice (n = 16, 32 mice; susceptible versus control, P = 0.002, Student's t‐test).
-
E
The immobility time in FST in susceptible mice, compared to control mice (n = 17, 35 mice; susceptible versus control, P = 0.0003, Student's t‐test).
-
F, G
The time in the open arms (F) and closed arms (G) in the EPM in susceptible mice, compared to control mice (n = 19, 33 mice; susceptible versus control, for open arms, P < 0.0001; for closed time, P < 0.0001, Student's t‐test).
-
H
The central distance in the OFT in susceptible mice, compared to control mice (n = 13, 28 mice; susceptible versus control, P = 0.0089, Student's t‐test).
-
I
The mRNA level of CD39, ENTPD2, and ENTPD3 in the hippocampus of susceptible mice after CSDS (n = 7, 8 mice; CSDS versus control, CD39 P = 0.0002, ENTPD2 P = 0.0025, Student's t‐test).
-
J
The CD39 protein expression in the hippocampus of susceptible mice induced by CSDS (n = 6, 7 mice; CSDS versus control, P = 0.0003, Student's t‐test).
-
K
The ATPase activity in the hippocampus of stressed animals (n = 6 mice/group; CSDS versus control, P = 0.0041, Student's t‐test).
Data information: Data are expressed as mean ± SEM. *
< 0.001. Hip, hippocampus; SI, social interaction; SPT, sucrose preference test; TST, tail suspended test; FST, forced swim test; EPM, elevated plus maze; OFT, open field test.

