-
A
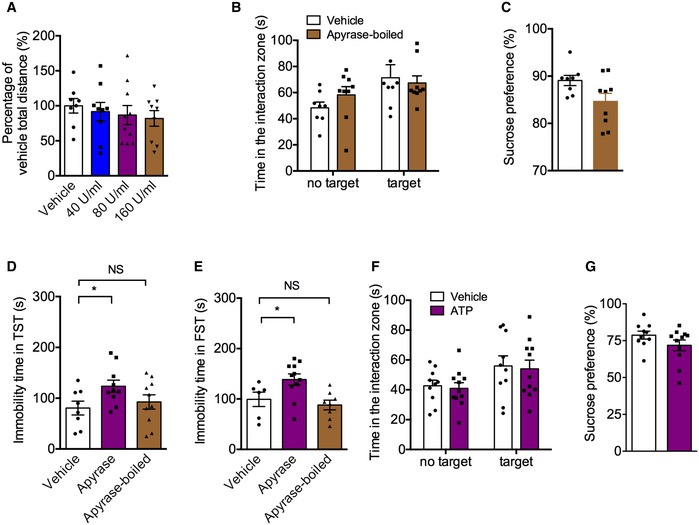
The locomotor activity of mice with apyrase (40, 80, or 160 U/ml) infusion into lateral intracerebroventricular in the open field test (n = 8, 9, 10, 9 mice; Treatment F
3,32 = 0.37, P = 0.7757, one‐way ANOVA with Fisher's LSD test).
-
B, C
Social interaction time (B) and sucrose preference (C) of mice with inactivated apyrase infusion into hippocampus (n = 8, 9 mice; for SI, Interaction F
1,30 = 1.039, P = 0.3162; Drug F
1,30 = 5.591, P = 0.0247; Target F
1,30 = 0.1890, P = 0.6669, two‐way ANOVA with Tukey's post‐test; for SPT, P = 0.0517, Student's t‐test).
-
D, E
Immobility time in the TST (D) and FST (E) of mice with apyrase and boiled‐apyrase (for TST, n = 8, 10, 10 mice; Treatment F
2,25 = 2.766, P = 0.0822; Apyrase versus vehicle, P = 0.0348; Apyrase‐boiled versus vehicle, P = 0.5386; for FST, n = 6, 11, 8 mice; Treatment F
2,22 = 5.92, P = 0.0088; Apyrase versus vehicle, P = 0.0307; Apyrase‐boiled versus vehicle, P = 0.5414, one‐way ANOVA with Fisher's LSD test).
-
F, G
Social interaction time (F) and sucrose preference (G) of normal mice with ATP (25 μM) infusion into hippocampus (n = 10, 11 mice; for SI, Interaction F
1,38 = 0.0005723, P = 0.9810; Drug F
1,38 = 6.520, P = 0.0148; Target F
1,38 = 0.1280, P = 0.7225, two‐way ANOVA with Tukey's post‐test; for SPT, P = 0.1484, Student's t‐test).
Data information: Data are expressed as the means ± SEM. NS
< 0.05.