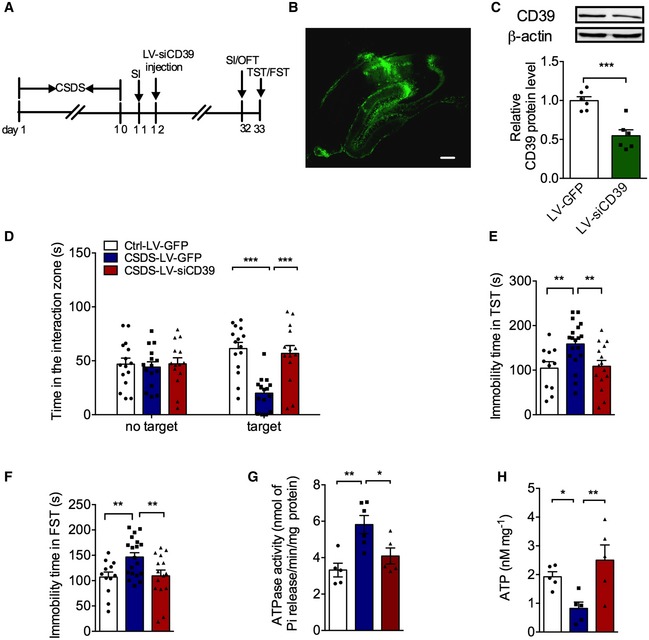
Experimental timelines for CSDS, virus stereotaxic injections, and behavioral study.
Imaging of GFP expression in the hippocampus 3 weeks after virus vector injection. Scale bar: 250 μm.
Expression of CD39 in the hippocampus of mice injected with LV‐siCD39 (n = 6 mice/group; LV‐siCD39 versus Control, P = 0.0006, Student's t‐test).
The social avoidance behavior for the stressed mice after knocking down CD39 (n = 15, 15, 14 mice; Interaction F
2,41 = 17.96, P < 0.0001; Target F
1,41 = 3.75e‐005, P = 0.9951; Drug F
2,41 = 6.099, P = 0.0048; for Target, CSDS – LV‐GFP versus Ctrl – LV‐GFP, P < 0.0001; CSDS – LV‐siCD39 versus CSDS – LV‐GFP, P < 0.0001, two‐way ANOVA with Tukey's post‐test).
The immobility time in the TST of mice injected with LV‐ siCD39 (n = 11, 19, 15 mice; Treatment F
2,42 = 5.807, P = 0.0059; CSDS – LV‐GFP versus Ctrl – LV‐GFP, P = 0.0069; CSDS – LV‐siCD39 versus CSDS – LV‐GFP, P = 0.0065, one‐way ANOVA with Fisher's LSD test).
The immobility time spent in the FST of mice treatment with LV‐siCD39 (n = 12, 19, 15 mice; Treatment F
2,43 = 5.237, P = 0.0092; CSDS – LV‐GFP versus Ctrl – LV‐GFP, P = 0.0095; CSDS – LV‐siCD39 versus CSDS – LV‐GFP, P = 0.0093, one‐way ANOVA with Fisher's LSD test).
The ATPase hyperactivity of mice after knocking down CD39 in the hippocampal (n = 5, 6, 5 mice; Treatment F
2,13 = 8.45, P = 0.0044; CSDS – LV‐GFP versus Ctrl – LV‐GFP, P = 0.0016; CSDS – LV‐CD39 versus CSDS – LV‐GFP, P = 0.0166, one‐way ANOVA with Fisher's LSD test).
The ATP level of mice after knocking down CD39 in the hippocampal (n = 5 mice/group; Treatment F
2,12 = 6.04, P = 0.0153; CSDS – LV‐GFP versus Ctrl – LV‐GFP, P = 0.0444; CSDS – LV‐CD39 versus CSDS – LV‐GFP, P = 0.0051, one‐way ANOVA with Fisher's LSD test).
Data information: Data are expressed as the means ± SEM. *
< 0.001.

