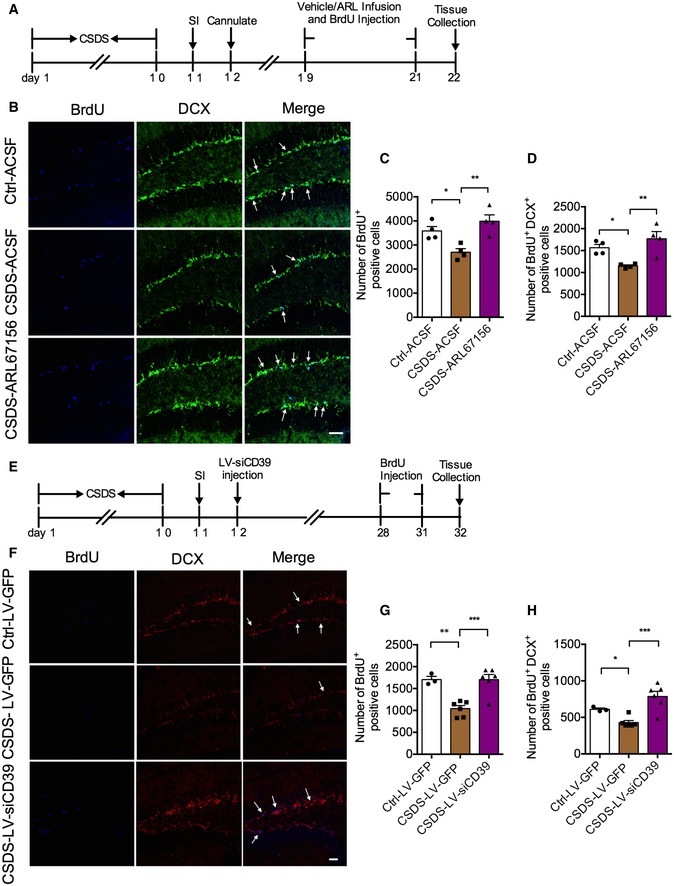
Figure 5. Inhibition and knockdown of CD39 increase hippocampal neurogenesis in susceptible mice.

-
AExperimental timelines for CSDS, ARL67156 treatment, and immunostaining.
-
BImmunostaining for BrdU (blue) and DCX (green) in the DG region of control, susceptible, and ARL67156 treatment mice. Arrows indicate the BrdU+ DCX+ cells. Scale bar: 50 μm.
-
C, DQuantification of BrdU+ cells (C) and BrdU+ DCX+ cells (D) in the DG of susceptible mice with ARL67156 compared with vehicle treatment (n = 4 mice/group; for BrdU+ Treatment F 2,9 = 10.07, P = 0.0051; CSDS – ACSF versus Ctrl – ACSF, P = 0.0147; CSDS – ARL67156 versus CSDS – ACSF, P = 0.0018; BrdU+ DCX+ Treatment F 2,9 = 9.005, P = 0.0071; CSDS – ACSF versus Ctrl – ACSF, P = 0.0211; CSDS – ARL67156 versus CSDS – ACSF, P = 0.0024, one‐way ANOVA with Fisher's LSD test).
-
EExperimental timelines for neurogenesis examination with LV‐siCD39.
-
FConfocal images of BrdU (blue) and DCX (red) in mice treatment with LV‐siCD39 in the DG. Arrows indicate the BrdU+ DCX+ cells. Scale bar: 50 μm.
-
G, HQuantitative of BrdU+ (G) and BrdU+ DCX+ (H) cells in the DG of susceptible mice with LV‐siCD39 compared with LV‐GFP treatment (n = 3, 6, 6 mice; for BrdU+ Treatment F 2,12 = 15.79, P = 0.0004; CSDS – LV‐GFP versus Ctrl – LV‐GFP, P = 0.0012; CSDS – LV‐siCD39 versus CSDS – LV‐GFP, P = 0.0003; BrdU+ DCX+ Treatment F 2,12 = 12.79, P = 0.0011; CSDS – LV‐GFP versus Ctrl – LV‐GFP, P = 0.05; CSDS – LV‐siCD39 versus CSDS – LV‐GFP, P = 0.0003, one‐way ANOVA with Fisher's LSD test).
