-
A
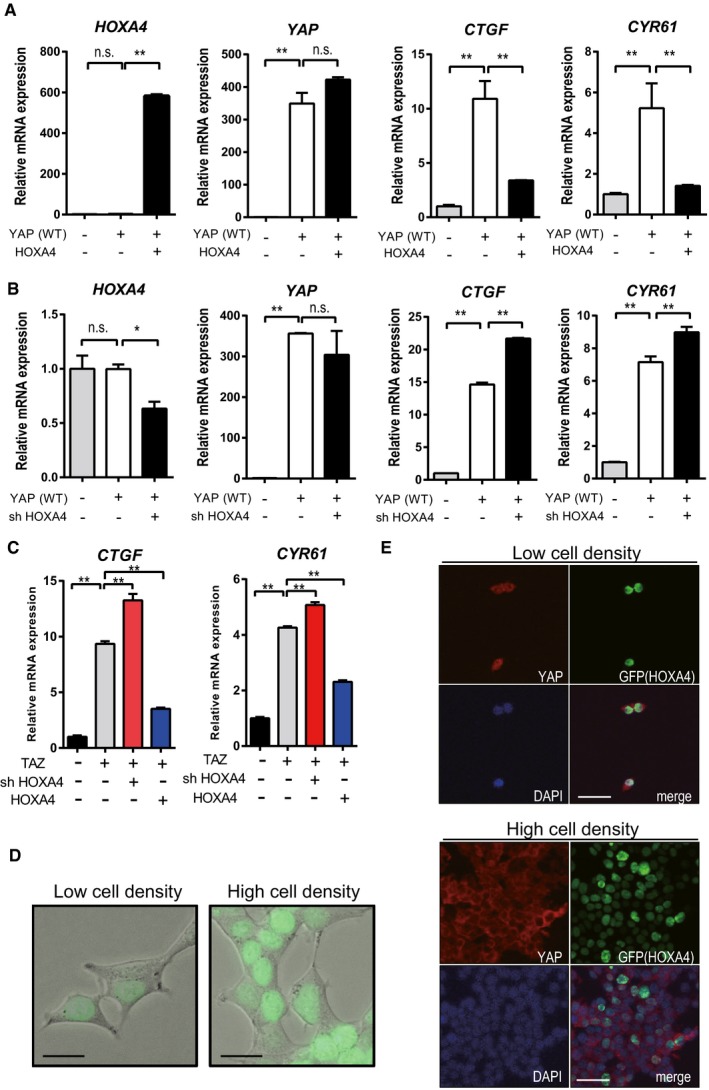
Quantitative real‐time PCR analysis of HOXA4, YAP, CTGF, and CYR61 in HEK 293T cells with overexpression of HOXA4 and WT YAP. **P < 0.01 versus YAP overexpression with LacZ, by ANOVA with Sidak's correction. Data are presented as mean ± SEM of three independent experiments.
-
B
Quantitative real‐time PCR analysis of HOXA4, YAP, CTGF, and CYR61 in HEK 293T cells with knockdown of endogenous HOXA4 and overexpression of WT YAP. *P < 0.05, **P < 0.01 versus YAP overexpression with shCtrl, by ANOVA with Sidak's correction. Data are presented as mean ± SEM of three independent experiments.
-
C
Quantitative real‐time PCR analysis of CTGF and CYR61 in HEK 293T cells with knockdown or overexpression of HOXA4 and overexpression of TAZ. **P < 0.01 versus TAZ overexpression, by ANOVA with Sidak's correction. Data are presented as mean ± SEM of three independent experiments.
-
D
Fluorescent images of HEK 293T cells transfected with GFP‐HOXA4 fusion protein under different cell densities. Scale bars indicate 50 μm.
-
E
Representative immunofluorescent staining images for YAP, GFP, and DAPI on HEK 293T cells transfected with GFP‐HOXA4 fusion protein under different cell densities. Scale bars indicate 50 μm.

