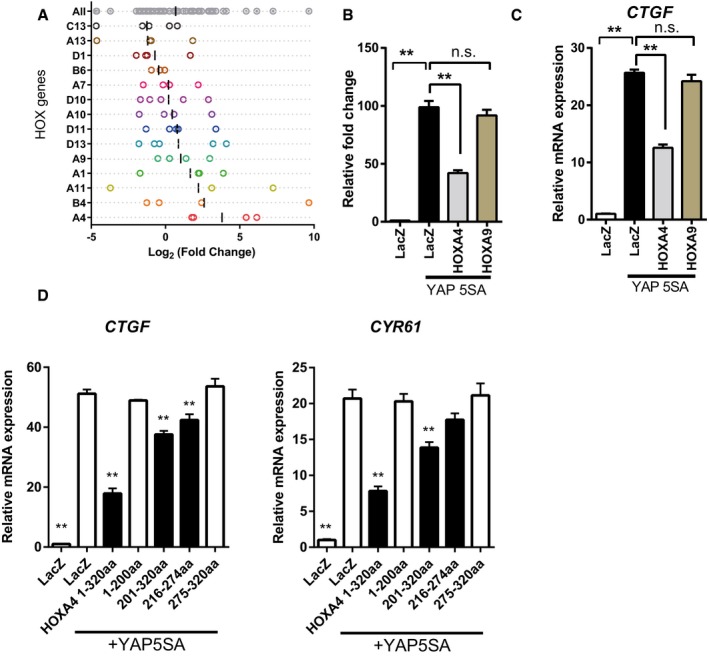
Figure EV3. Suppression of YAP/TEAD transcriptional activity is specific for HOXA4.

-
ADistribution of the frequency of each shRNA targeting HOX family genes in shRNA screen. Log2 (fold change) of each shRNA abundance in the “GFP high” pool compared with the “GFP low” pool is shown. Each dot represents different shRNAs, and vertical solid line represents the mean value. Three to five shRNAs against each HOX gene are contained in the library.
-
B, CLuciferase reporter assay using 8xGTIIC‐luciferase (B) and quantitative real‐time PCR of CTGF (C) in HEK 293T cells with overexpression of YAP‐5SA and HOXA4 or HOXA9.
-
DQuantitative real‐time PCR analysis of CTGF and CYR61 in HEK 293T cells with overexpression of YAP‐5SA and truncated mutants of HOXA4.
