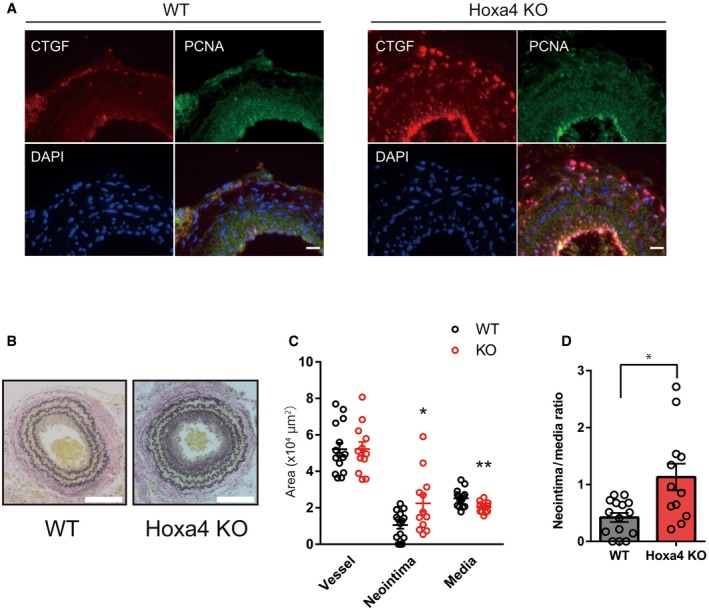
Figure EV5. Neointima formation in Hoxa4‐deficient mice.

-
ARepresentative immunofluorescent staining images for CTGF and PCNA on the neointima in left carotid arteries at 4 weeks after ligation. Sections are obtained at 1,000 μm proximal to the ligation. Scale bars indicate 20 μm.
-
BRepresentative images showing EVG staining of left carotid arteries of WT and Hoxa4 KO mice at 4 weeks after ligation. Sections are obtained at 500 μm proximal to the ligation. Scale bars indicate 100 μm.
-
CVessel, neointima, and media area measured at 500 μm proximal to the ligation. Age‐ and sex‐matched WT (n = 15) or Hoxa4 KO (n = 12) mice were subjected to carotid artery ligation. *P < 0.05, **P < 0.01 versus WT, by unpaired two‐tailed Mann–Whitney test. Data are presented as mean ± SEM.
-
DNeointima‐to‐media layer ratio measured at 500 μm proximal to the ligation. Age‐ and sex‐matched WT (n = 15) or Hoxa4 KO (n = 12) mice were subjected to carotid artery ligation. *P < 0.05, by unpaired two‐tailed Mann–Whitney test. Data are presented as mean ± SEM.
