-
A
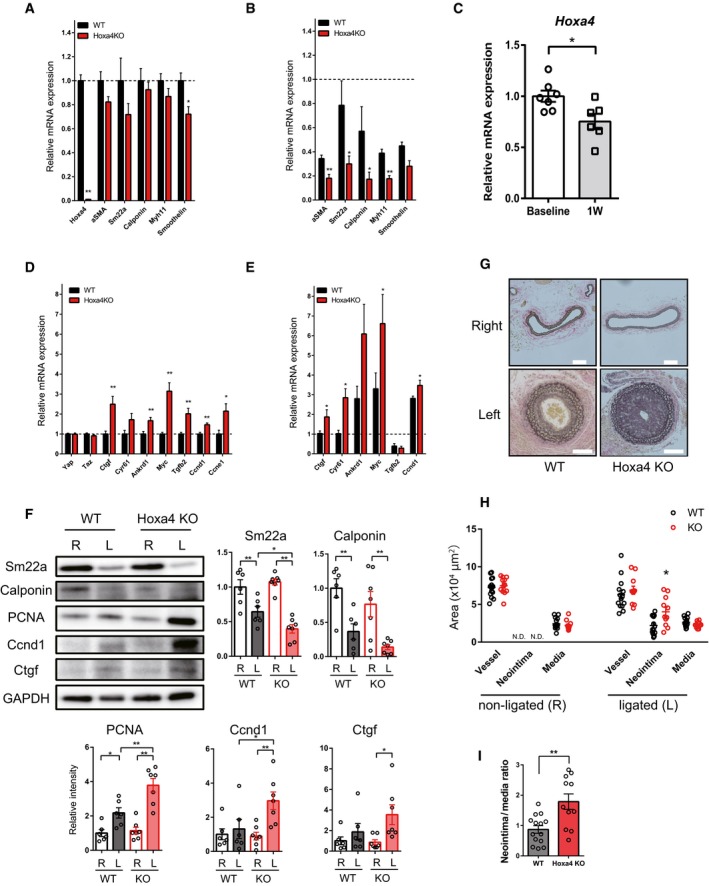
Quantitative real‐time PCR analysis of differentiated smooth muscle marker genes in the left carotid artery of 8‐week‐old WT and Hoxa4 KO mice (WT: n = 7; Hoxa4 KO: n = 5).
-
B
Quantitative real‐time PCR analysis of differentiated smooth muscle marker genes in the ligated left carotid artery of WT and Hoxa4 KO mice at 1 week after ligation (n = 6). Mean expression level of six WT mice at the baseline was defined as 1.0.
-
C
Hoxa4 expression levels in the ligated left carotid artery of WT mice at 1 week after ligation (n = 6).
-
D
Quantitative real‐time PCR analysis of Yap/Tead target genes in the left carotid artery of 8‐week‐old WT and Hoxa4 KO mice (WT: n = 7; Hoxa4 KO: n = 5).
-
E
Quantitative real‐time PCR analysis of Yap/Tead target genes in the ligated left carotid artery of WT and Hoxa4 KO mice at 1 week after ligation (n = 6). Mean expression level of six WT mice at the baseline was defined as 1.0.
-
F
Representative Western blotting analysis and densitometry of non‐ligated (right; R) and ligated (left; L) carotid arteries from WT and Hoxa4 KO mice at 1 week after ligation (WT: n = 6; Hoxa4 KO: n = 7). *P < 0.05, **P < 0.01, by two‐way ANOVA with Sidak's correction.
-
G–I
Representative images showing Elastica van Gieson staining (G); vessel, neointima, and media area (H); and neointima‐to‐media layer ratio (I) of carotid arteries of WT and Hoxa4 KO mice at 4 weeks after ligation (WT: n = 14; Hoxa4 KO: n = 11).
Data information: Images and data were obtained at 250 μm proximal to the ligation. Scale bars indicate 100 μm. *
P < 0.05, **
P < 0.01 versus WT, except in (C) versus baseline, by unpaired two‐tailed Mann–Whitney test. Data are presented as mean ± SEM. N.D., not detected.

