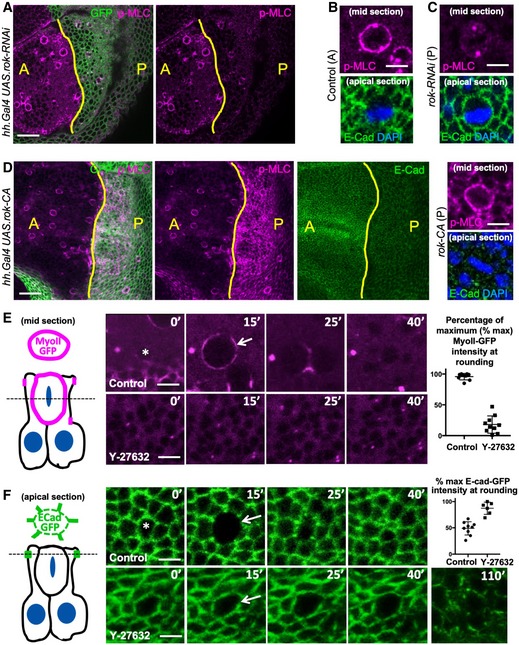
Phosphorylated Myosin‐II regulatory light chain (p‐MLC; purple) detected by antibody staining reveals high levels around the cortex of rounded mitotic cells in wild‐type wing epithelial cells in the anterior (A) compartment, but not in Rho‐kinase (Rok) RNAi expressing cells of the posterior (P) compartment (GFP‐positive; green). Scale bar ˜10 μm. n > 10 independent biological replicates.
High‐magnification view of single mitotic cell stained for p‐MLC (purple) and E‐cadherin (green), with metaphase plate chromosomes stained by DAPI (blue). Scale bar ˜1 μm. n > 10 independent biological replicates.
High‐magnification view of single UAS.Rok‐RNAi expressing mitotic cell stained for p‐MLC (purple) and E‐cadherin (green), with metaphase plate chromosomes stained by DAPI (blue). Note loss of cortical p‐MLC staining (purple). Scale bar ˜1 μm. n > 10 independent biological replicates.
Expression of constitutively active Rho‐kinase (UAS.Rok‐CA) in the posterior compartment of the wing epithelium is sufficient to elevate p‐MLC and reduce E‐cadherin immunostaining. Zoom (right) shows high p‐MLC and low E‐cad in both a mitotic cell and its neighbours. Scale bar ˜10 μm. n > 10 independent biological replicates.
MyoII RLC‐GFP (MyoII‐GFP) accumulates at the cortex as cells round up for mitosis and later appears at the cleavage furrow during cytokinesis (basal section, diagrammed left). Treatment with the Rho‐kinase inhibitor Y‐27632 inhibits mitotic accumulation of MyoII‐GFP. Quantification shown right (n = 8 independent samples per genotype). Scale bar ˜1 μm. Mean ± 1 SD shown.
E‐cad‐GFP is downregulated as cells round up for mitosis (apical section, diagrammed left). Treatment with the Rho‐kinase inhibitor Y‐27632 inhibits mitotic downregulation of E‐cad‐GFP. Extended treatment with Y‐27632 leads to a general defect in all interphase and mitotic cells in which apical surface areas enlarge and E‐cad‐GFP is generally lost. Arrow indicates mitotic cell cortex at maximal rounding. Quantification shown right (n = 6 independent samples per genotype; mean ± 1 SD shown). Scale bar ˜1 μm.

