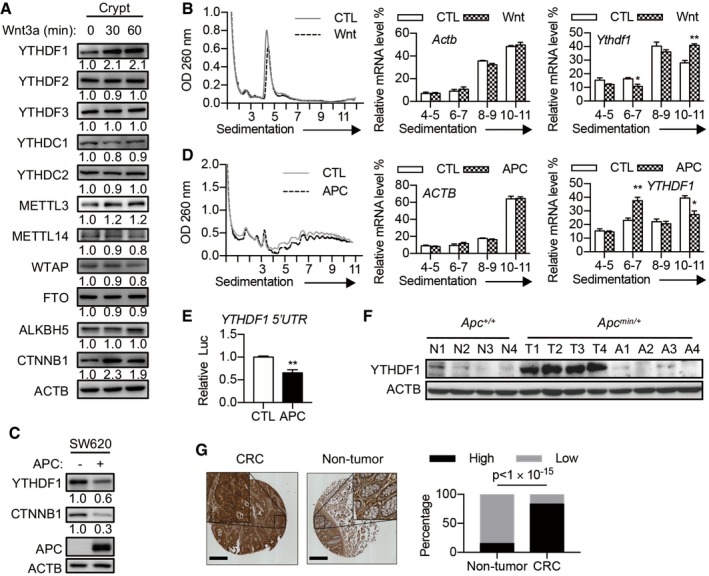
Figure 1. Wnt signaling promotes YTHDF1 expression at the translational level.

- Immunoblot analysis of mouse intestinal crypts treated with Wnt3a (60 ng/ml) for indicated time. The relative protein level was quantified and shown under each band.
- Polysome profiles of mouse intestinal crypt treated with or without Wnt3a for 30 min. The right panels show the distributions of Ythdf1 and Actb in polysome fractions. Data are represented as mean ± SEM. *P < 0.05, **P < 0.01 (3 biological replicates, t‐test).
- Immunoblot analysis of SW620 cells with or without APC overexpression. The relative protein level was quantified and shown under each band.
- Polysome profiles of SW620 cells with or without APC overexpression. The right panels show the distributions of YTHDF1 and ACTB in polysome fractions. Data are represented as mean ± SEM. *P < 0.05, **P < 0.01 (3 biological replicates, t‐test).
- Dual‐Luciferase Assay with a construct bearing the 5′UTR of YTHDF1 in SW620 cells with or without APC overexpression. Data are represented as mean ± SEM. *P < 0.05, **P < 0.01 (3 biological replicates, t‐test).
- YTHDF1 protein expression in intestinal tissue from 4 pairs of Apc +/+ and Apc min/+ mice. N, normal tissue. T, tumor tissue. A, tumor‐adjacent tissue.
- YTHDF1 staining in matched samples of human CRC tissue and adjacent non‐tumor tissue. Scale bar, 450 μm. The right panel shows the statistics of IHC scores. Chi‐square test; n = 75 for each group.
Source data are available online for this figure.
