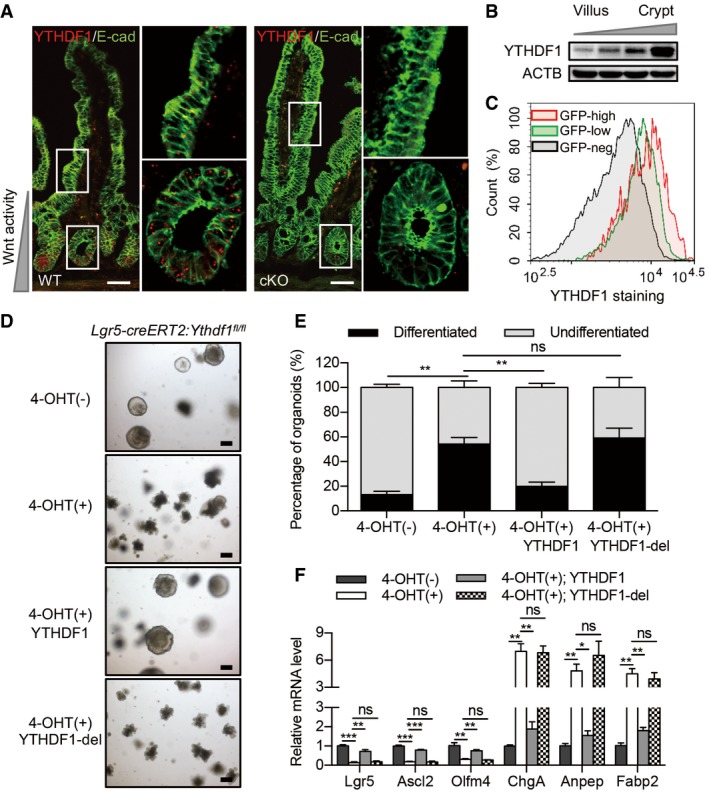
Figure 4. YTHDF1 is required for maintenance of intestinal stem cells.

- Fluorescent in situ hybridization for Ythdf1 mRNA in Ythdf1 CTL and Ythdf1 cKO small intestines. Scale bar, 50 μm.
- Immunoblot analysis of fractionated murine intestine enriched for villus cells and crypt cells.
- Flow cytometry analysis of YTHDF1 protein expression in GFPhigh/low/neg populations from Lgr5‐GFP‐IRES‐creERT2 mice.
- Morphology of organoids from Lgr5‐creERT2:Ythdf1 fl/fl mice in Wnt3a‐conditioned medium without or with 4‐OHT induction and infected with lentivirus expressing YTHDF1 or YTHDF1 mutant. Scale bar, 250 μm.
- Quantification of differentiated versus undifferentiated organoids from (D). Data are represented as mean ± SEM. **P < 0.01 (4 biological replicates, t‐test).
- Relative mRNA levels of intestinal stem cell and differentiation marker genes in organoids described in (D). Data are represented as mean ± SEM. 4 biological replicates. *P < 0.05, **P < 0.01, ***P < 0.001 (t‐test).
Source data are available online for this figure.
