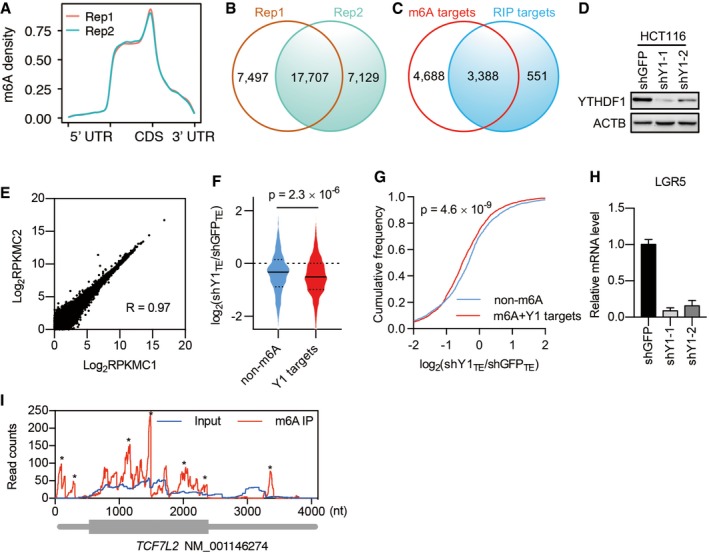
Figure EV4. Analysis of YTHDF1‐regulated mRNA translation.

- Metagene plot of m6A peak distribution from two biological replicates.
- m6A peaks identified from two biological replicates.
- Overlap of m6A‐containing transcripts (m6A targets) with YTHDF1‐binding transcripts (RIP targets).
- YTHDF1 knockdown efficiency in HCT116 cells.
- Correlation of ribosome density between two control biological replicates.
- Violin plots showing translational efficiency (TE) change after YTHDF1 knockdown for non‐methylated (non‐m6A) transcripts and YTHDF1 targets. The upper and lower quartiles and the median are indicated for each group. Mann–Whitney test.
- Cumulative distributions of TE change after YTHDF1 knockdown for non‐m6A transcripts and YTHDF1 targets as in (E). Kolmogorov–Smirnov test.
- RT–qPCR analysis of LGR5 expression in HCT116 cells after YTHDF1 knockdown. Data are represented as mean ± SEM. 3 biological replicates.
- m6A peak distribution within TCF7L2 transcript. * indicates the predicted m6A peak.
Source data are available online for this figure.
