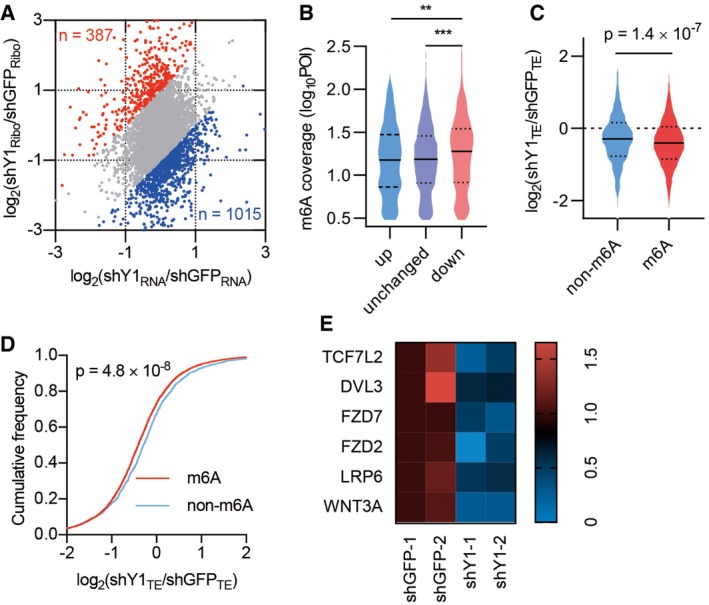
Figure 5. Transcriptome‐wide identification of YTHDF1‐regulated mRNAs.

- Scatterplot of mRNA expression and ribosome profiling data from control and YTHDF1 knockdown cells. The upregulated (red) and downregulated (blue) genes in translational efficiency (TE) are highlighted.
- The relative m6A peak coverage in control cells for transcripts grouped according to TE changes after YTHDF1 knockdown. POI: peak over input. Down, genes significantly downregulated in YTHDF1 knockdown cells (< 0.5 fold). Unchanged, genes not significantly changed. Up, genes significantly upregulated (> 2 fold). The upper and lower quartiles and the median are shown for each group. Mann–Whitney test. **P < 0.01. ***P < 0.001.
- Violin plots showing TE change between control and YTHDF1 knockdown cells for non‐methylated (non‐m6A) and methylated (m6A) transcripts. The upper and lower quartiles and the median are indicated for each group. Mann–Whitney test.
- Cumulative distributions of TE change for non‐m6A and m6A transcripts as in (C). Kolmogorov–Smirnov test.
- Heatmap showing the TE of Wnt signaling components in control and YTHDF1 knockdown cells. The values show the fold change of the indicated color of the heatmap.
