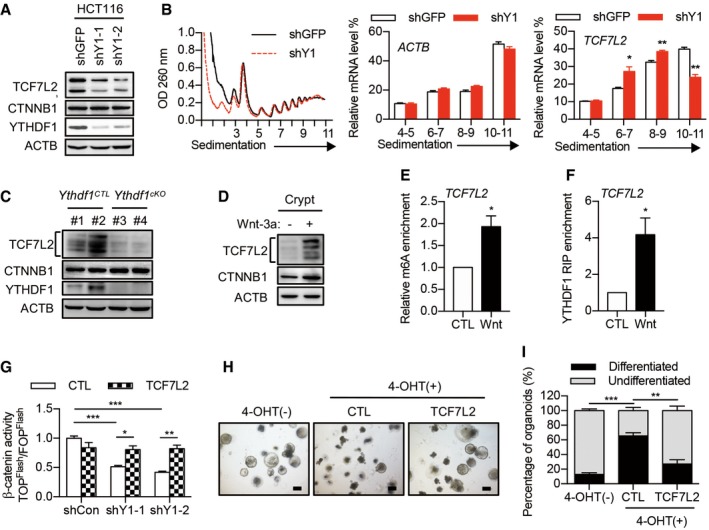
Figure 6. TCF7L2 is a key functional target of YTHDF1.

- Immunoblot analysis of HCT116 cells with YTHDF1 knockdown. Two major bands were detected for human TCF7L2 due to alternative splicing.
- Polysome profiles of HCT116 cells with or without YTHDF1 knockdown. The right panels show the distributions of TCF7L2 and ACTB in polysome fractions. Data are represented as mean ± SEM. *P < 0.05, **P < 0.01 (3 biological replicates, t‐test).
- Immunoblot analysis of crypts from Ythdf1 CTL and Ythdf1 cKO mice. Multiple bands were detected for mouse TCF7L2 representing different isoforms.
- Immunoblot analysis of mouse intestinal crypts treated with Wnt3a for 60 min.
- MeRIP‐qPCR analysis of m6A levels of TCF7L2 in crypts treated with or without Wnt3a. Data are represented as mean ± SEM. *P < 0.05 (3 biological replicates, t‐test).
- RIP analysis of the interaction of YTHDF1 with TCF7L2 mRNA. The enrichment was measured by qPCR and normalized to input. Data are represented as mean ± SEM. *P < 0.05 (3 biological replicates, t‐test).
- β‐catenin/TCF4 reporter activity in YTHDF1 knockdown cells infected with lentivirus expressing TCF7L2. Data are represented as mean ± SEM. *P < 0.05, **P < 0.01, ***P < 0.001 (3 biological replicates, t‐test).
- Morphology of organoids from Lgr5‐creERT2:Ythdf1 fl/fl mice in Wnt3a‐conditioned medium without or with 4‐OHT induction and infected with lentivirus expressing TCF7L2. Scale bar, 250 μm.
- Quantification of differentiated versus undifferentiated organoids from (H). Data are represented as mean ± SEM. **P < 0.01, ***P < 0.001 (3 biological replicates, t‐test).
Source data are available online for this figure.
