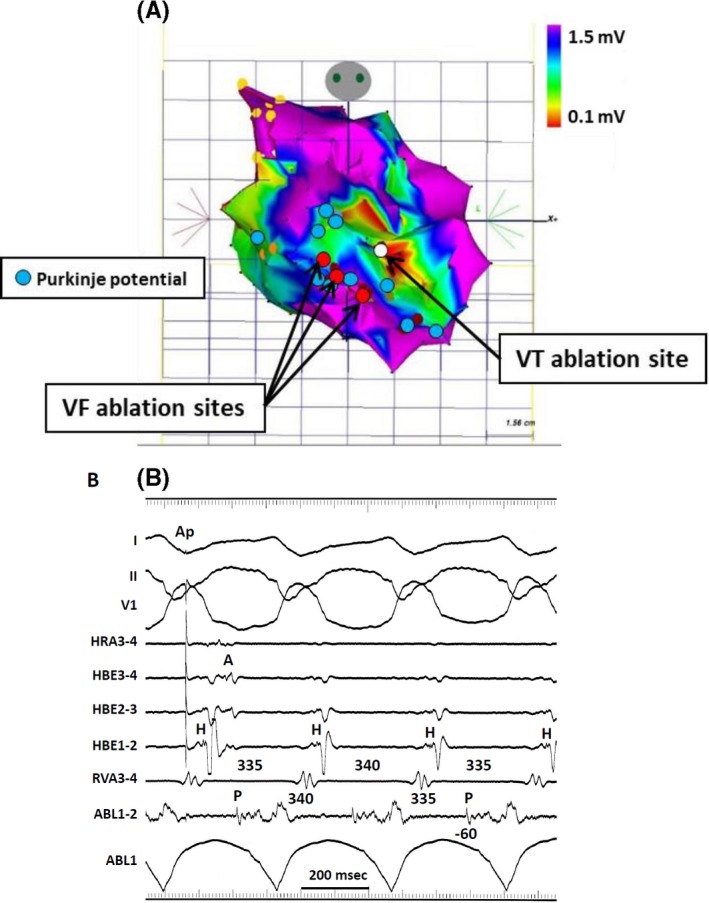
Figure 9‐5.

Electroanatomical mapping of postinfarction, Purkinje‐fiber mediated VT. A, The electroanatomical map was created during the second session for monomorphic VT. The red tag indicates the ablation site for ventricular fibrillation in the first session, superimposed on the same map. The white tag indicates the successful ablation site for VT in the second session. The blue tags indicate the Purkinje potentials during sinus rhythm. B, Diastolic Purkinje potentials were recorded during VT and the change of P‐P intervals preceded the changed of V‐V intervals. Single RF energy delivery terminated the VT (From Masuda K, Nogami A, Kuroki K, et al. Conversion to Purkinje‐related monomorphic ventricular tachycardia after ablation of ventricular fibrillation in ischemic heart disease. Circ Arrhythm Electrophysiol. 2016; 9. pii: e004224. With permission.)
