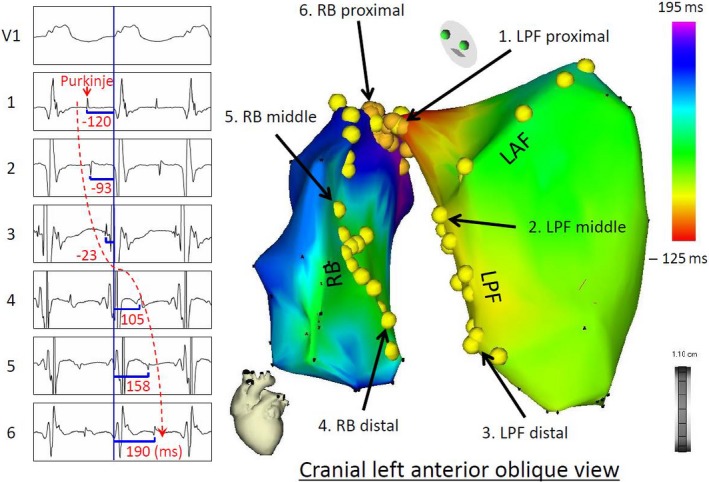
Figure 9‐8.

A 3D activation map (right panel) of BBR‐VT descending the left posterior fascicle (LPF) and ascending the right bundle branch (RBB), with the earliest activation displayed in red (LPF proximal) and the latest in violet (RBB proximal). The yellow dots and the numbered sites with arrows indicate fascicular potentials and local activations of the His‐Purkinje system (left panel), respectively. Sequential activations of the local His‐Purkinje system accounted for the entire tachycardia cycle length. The propagation map of BBR‐VT also demonstrated that anterograde activation through the left anterior fascicle and LPF resulted in a collision at the middle portion of the left anterior fascicle—a bystander of the reentrant circuit (Supplemental Video 9‐4). From Machino T, et al: Three‐dimensional visualization of the entire reentrant circuit. Heart Rhythm 10:459‐460, 2013. With permission
