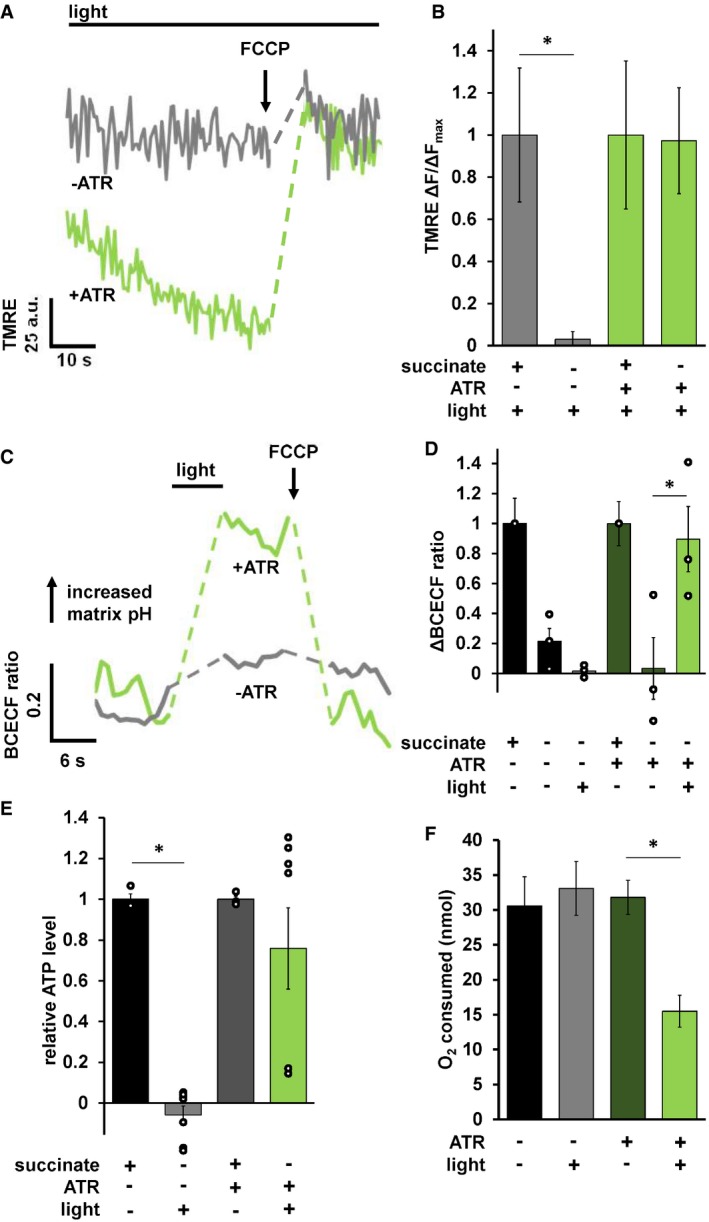
Figure 2. mtON activation increases the PMF.

- Representative TMRE fluorescence traces in arbitrary units (a.u.) before and after Δψm dissipation with FCCP. Dashed lines indicate where FCCP was added. +/− ATR traces were performed in the absence of succinate. mtON activation was continuous throughout the traces. Light green trace is from mitochondria with ATR, gray traces are without.
- Quantification of change in fluorescence (ΔF) normalized to the maximum change in fluorescence given by succinate respiration (ΔF max) for each mitochondrial preparation. Data are from the maximum light dose in Fig EV3A. Two‐way ANOVA with Sidak's test for multiple comparisons, *P = 0.0469, +ATR succinate versus +ATR +light P = 0.9978, n = 6 mitochondrial isolations. Data show mean ± SEM.
- Representative BCECF‐AM 490/440 nm ratio trace. Ratio of 545 nm fluorescence intensity at either 440 or 490 nm excitation. Dashed lines are where light or FCCP treatment occurred. Light green trace is from mitochondria with ATR, gray traces are without.
- Quantification of change in BCECF‐AM fluorescence ratio normalized to maximum change given by succinate matrix alkalization. Two‐way ANOVA with Sidak's test for multiple comparisons, −ATR succinate versus −ATR, +light *P = 0.0212, +ATR succinate versus +ATR light P = 0.999, +ATR succinate versus +ATR, −light P = 0.0237, +ATR, +light versus, +ATR, −light P = 0.0474, n = 3 mitochondrial isolations. Some individual points overlap. Data show mean ± SEM.
- ATP levels normalized to total ATP synthesis given by succinate respiration. Data from Fig EV3B. Succinate data shown for comparison after normalization. Two‐way ANOVA with Sidak's test for multiple comparisons, *P = 0.0011, +ATR succinate versus +ATR light P = 0.5680, n = 3, 7, 3, 7 biological replicates for each bar from left to right. Some individual points overlap. Data show mean ± SEM.
- O2 required to consume 50 nmoles of ADP after mtON activation. Data are the maximum illumination from Fig EV4D using time‐matched dark conditions, one‐way ANOVA *P = 0.013 (−ATR, −light versus +ATR, +light P = 0.010. −ATR, +light versus +ATR, +light P = 0.013.) −ATR, −light n = 5, rest n = 6 mitochondrial preparations. Data show mean ± SEM.
