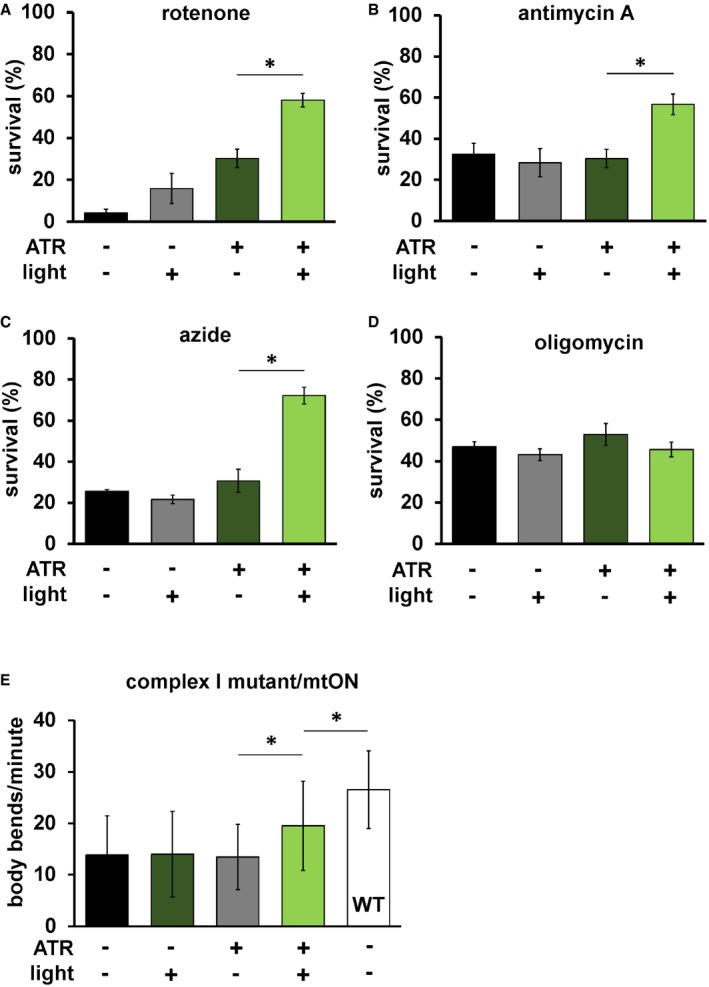
Day 1 adult animals expressing mtON were exposed to 50 μM rotenone (ETC complex I inhibitor) for 5 h, and survival was scored. Illumination was continuous throughout toxin exposure (see Materials and Methods). ATR alone was protective (−ATR, −light versus +ATR, −light P = 0.016.) The effect of mtON activation was greater than the ATR alone effect, one‐way ANOVA with Tukey's post hoc test *P = 0.01. (−ATR, −light versus +ATR, +light P = 0.0002. −ATR, +light versus +ATR, +light P = 0.0009. n = 3 plates each condition with at least 15 animals per plate). Data show mean ± SEM.
mtON‐expressing animals were exposed to 50 μM antimycin A (complex III inhibitor), and survival was scored 18 h later. One‐way ANOVA with Tukey's post hoc test *P = 0.02 (−ATR, −light versus +ATR, +light P = 0.03, −ATR, +light versus +ATR, +light P = 0.01. n = 5 plates each condition with at least 15 animals per plate). Data show mean ± SEM.
mtON‐expressing animals were exposed to 0.25 M azide (complex IV inhibitor) for 1 h and scored for survival 1 h after recovering, one‐way ANOVA with Tukey's post hoc test *P = 0.0002. (−ATR, −light versus +ATR, +light P < 0.0001, −ATR, +light versus +ATR, +light P < 0.0001. n = 3 plates each condition with at least 15 animals per plate). Data show mean ± SEM.
mtON‐expressing animals were exposed to 31 μM oligomycin A (ATP synthase inhibitor), and survival was scored 18 h later. No significant differences were found by one‐way ANOVA (n = 3 plates each condition with at least 15 animals per plate). Data show mean ± SEM.
mtON‐expressing animals in a complex I mutant background (gas‐1) were scored for locomotion speed in the presence of food by counting body bends per minute. mtON activation rescued the decreased locomotion of the gas‐1 mutant background, one‐way ANOVA with Tukey's post hoc test, −ATR, +light versus +ATR, +light *P = 0.0145, +ATR, +light versus wild type (WT) *P = 0.0008 (−ATR, −light versus +ATR, +light P = 0.0272, +ATR, −light versus +ATR, +light P = 0.0332, all conditions versus WT, P < 0.001, n = 30, 30, 30, 41, 41 animals each bar from left to right). Data show mean ± standard deviation.

