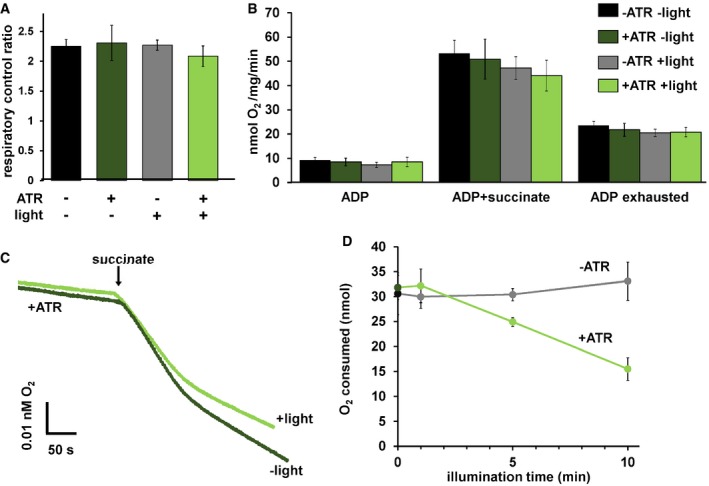
Figure EV4. mtON effects on respiration.

- Respiratory control ratios (indicative of ability of isolated mitochondria to respond to energy demand) were calculated by dividing the rate of O2 consumption with ADP and succinate by the rate after ADP was depleted. One‐way ANOVA with Tukey's post hoc test, P = 0.72, n = 6 mitochondrial preparations. Data show mean ± SEM.
- O2 consumption rates under different states of respiration comparing the control conditions. One‐way ANOVA with Tukey's post hoc tests performed for each respiration state. ADP rate P = 0.66, succinate rate P = 0.61. ADP exhausted rate P = 0.83. n = 6 mitochondrial preparations. Data show mean ± SEM.
- Representative traces depicting O2 consumption rate. +/− light for mitochondria with ATR present. Light exposure was 10 min before the addition of succinate. Traces show an initial rapid depletion of ADP before transitioning to a lower rate of O2 consumption.
- Activation of mtON decreases the amount of O2 required to consume 50 nmoles ADP light dose‐dependently. Isolated mitochondria were exposed to light for the indicated time and then succinate was added (example traces in panel C). Dark and 10‐min illumination data were used for analysis in Fig 2F. Linear regression showed a negative relationship between O2 required to consume ADP and illumination time in mitochondria from animals with mtON that were supplemented with ATR, R 2 = 0.98 P = 0.007, n = 6 mitochondrial preparations. Linear regression shows no relationship between O2 required to consume ADP and illumination in mitochondria from animals with mtON not supplemented with ATR, R 2 = 0.756 P = 0.130, dark n = 5, 1‐min light n = 5, 5‐min light n = 6, 10‐min light n = 6. Each n is an independent mitochondrial preparation. Data show mean ± SEM.
