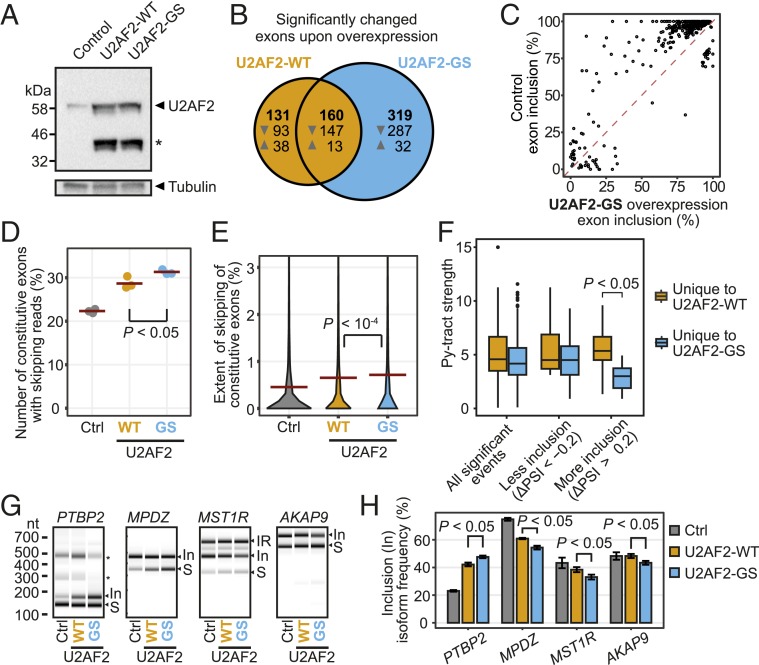
Fig. 5.
Overexpression of U2AF2-WT and U2AF2-GS impairs constitutively spliced exons. (A) Western blot documents overexpression of U2AF2-WT and U2AF2-GS in human HeLa cells. Tubulin served as loading control. An asterisk marks a U2AF2 cleavage product. (B) U2AF2-WT OE leads to down-regulation of alternatively spliced exons, which is further augmented by U2AF2-GS. Venn diagram comparing significantly regulated exons (FDR < 0.05) upon OE of U2AF2-WT (orange) or U2AF2-GS (blue). Up- and down-regulated exons (indicated by arrowheads) are given in each section. (C) Most down-regulated exons show more than 80% inclusion in untreated cells. Scatterplot of inclusion levels (in percent spliced-in; PSI) in untreated HeLa cells (control) and upon U2AF2-GS OE. (D) More constitutive exons are skipped upon U2AF2-GS OE. Dot plot showing the percentage of constitutive exons (n = 37,052) with at least one junction-spanning read that supports skipping upon overexpression of U2AF2-WT (orange) or U2AF2-GS (blue) versus empty vector (gray, Ctrl). P value < 0.05 for all pairwise comparisons by Student’s t test. Only the P value for the selected comparison is shown. (E) Constitutive exons show an increased extend of skipping upon U2AF2-GS OE. Violin plot shows the distribution of percent skipping for constitutive exons as in E. Dashed lines indicate the mean value. P value < 0.001 for all pairwise comparisons by Student’s t test. Only the P value for the selected comparison is shown. (F) Strongly down-regulated exons upon U2AF2-GS OE have weaker Py-tracts. Box plot displays the Py-tract strengths for significantly regulated events (FDR < 0.05) with |ΔPSI| > 20% that are uniquely regulated upon overexpression of U2AF2-WT (orange) or U2AF2-GS (blue). P value from Student’s t test with Bonferroni correction. Only the P value for the selected comparison is shown. Boxes represent quartiles, center lines denote 50th percentile, and whiskers extend to most extreme values within 1.5× the interquartile range. Extended plot with exon numbers in each category is shown in SI Appendix, Fig. S11. (G) Reporter minigenes confirm effects of U2AF2-GS OE on splicing. Semiquantitative RT-PCR analyses of four alternatively spliced exons (PTBP2 exon 10, MPDZ exon 18, MST1R exon 11, AKAP9 exon 19) upon overexpression of U2AF2-WT (orange) or U2AF2-GS (blue) versus empty vector (gray; Ctrl). Gel views of capillary electrophoresis of the PCR products for exon inclusion (In) and skipping (“S”) marked on the right. Intron retention products (IR; MST1R) and unassigned isoforms (asterisks; PTBP2) are marked. (H) Quantification of alternative splicing changes in G. Bar diagrams depict the mean inclusion level in each sample. Error bars represent SD of mean; n = 3. n.s., P values from Student’s t test with Benjamini–Hochberg correction. Only P values for the selected comparisons are shown.

