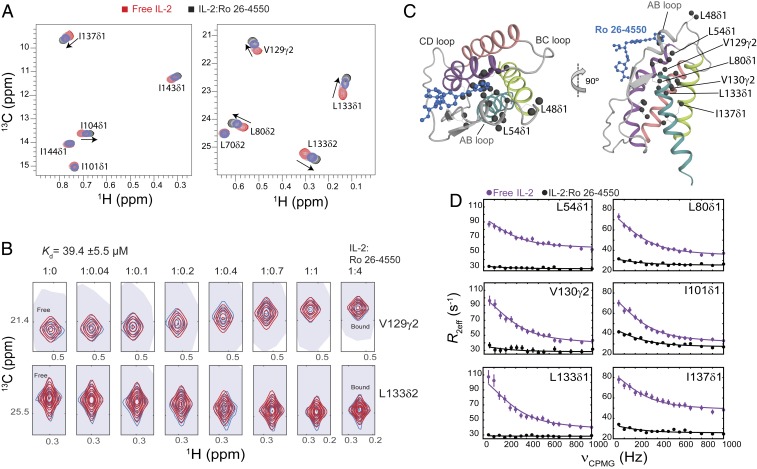
Fig. 5.
Small molecule binding at the AB loop quenches dynamics of mIL-2. (A) The 2D 1H,13C-HMQC spectra of ILV-methyl–labeled mIL-2 in the free state (red), and with increasing concentrations of Ro 26-4550 inhibitor (1:4 molar ratio, shown in black). Data were recorded at 800 MHz, 25 °C. Fast-exchange chemical shift changes are highlighted with arrows for select methyl resonances. (B) NMR line shape analysis for the V129γ2 and L133δ2 methyl resonances using TITAN (Materials and Methods), with indicated equilibrium dissociation constant and errors propagated from the spectral S/N. Recorded NMR spectra are shown in blue, with simulated line shapes in red. Ratios of mIL-2 to inhibitor are indicated in each panel. (C) Two views showing the mapping of residues undergoing significant chemical shift perturbations (CSPs) onto the ribbon representation of mIL-2. Methyl groups with marked CSPs (>0.05 ppm) are shown as black spheres. The inhibitor is shown as a blue ball-and-stick diagram on the overlaid hIL-2 complex structure (PDB ID code 1M48). (D) The 13C single quantum CPMG relaxation dispersion profiles in the absence (purple) and presence of Ro 26-4550 at saturating concentration (black) for selected residues in the AB loop (L54δ1), B Helix (L80δ1), C Helix (I101δ1), and D Helix (V130γ2, L133δ1, I137δ1). CPMG experiments were performed at a 1H field of 600 MHz and 25 °C.

