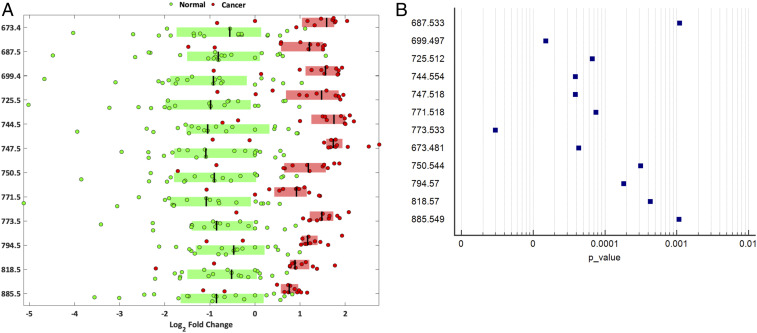
Fig. 5.
Lipid groups of the identified 12 significant peaks. (A) Box plots of the top m/z peaks contributing to class separation (log2 fold change), based on the univariate analysis between normal and cancerous cervical tissue. The log2 fold changes are determined based on the median spectrum over all observations. The 12 most significant and intense REIMS spectra peaks are shown with P < 0.001, q < 0.001. (B) Forest plot of the P values of the 12 significant peaks identified during the univariate analysis between normal and cancerous cervical tissue.

