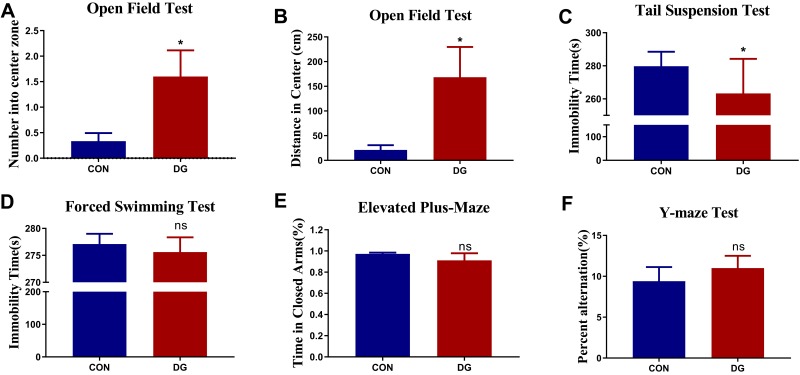
Figure 2.
Effects of DG treatment on performance in behavioral tests. (A) The number of entries in the central area in the open field test (OFT). (B) The distance traveled in the central area in the OFT. (C) Immobility time in the tail suspension test (TST). (D) Immobility time in the forced swimming test (FST). (E) The percentage of time spent in the closed arm in the elevated plus-maze (EPM). (F) The percent alternation in the Y-maze test after 4 weeks of DG treatment. Values represent the mean ± SEM (n = 15 rats per group). *p < 0.05, ns = not significant, compared with the control (CON) group.

