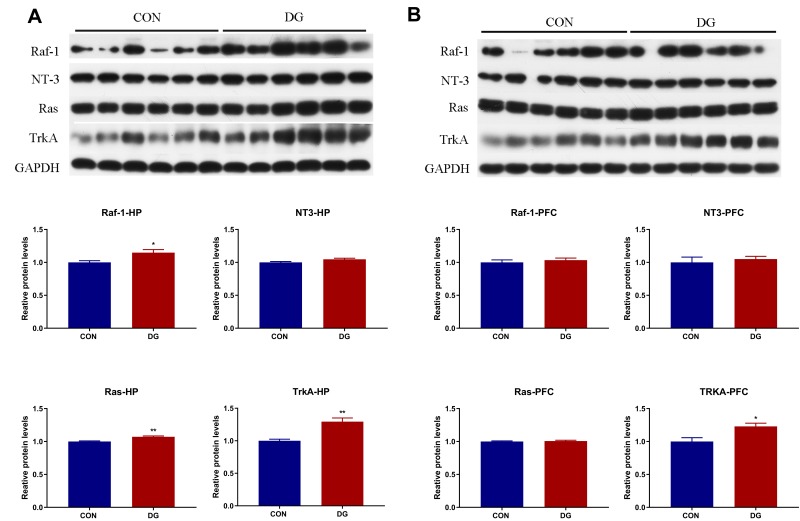
Figure 9.
The candidate proteins selected for Western blot analysis. In the DG group, compared with the CON group, the expression levels of Raf, NT3, Ras and TrkA were significantly increased in the HP (A), and the expression levels of TrkA were significantly increased in the PFC (B).*p < 0.05, **p < 0.01.

