Fig. 3.
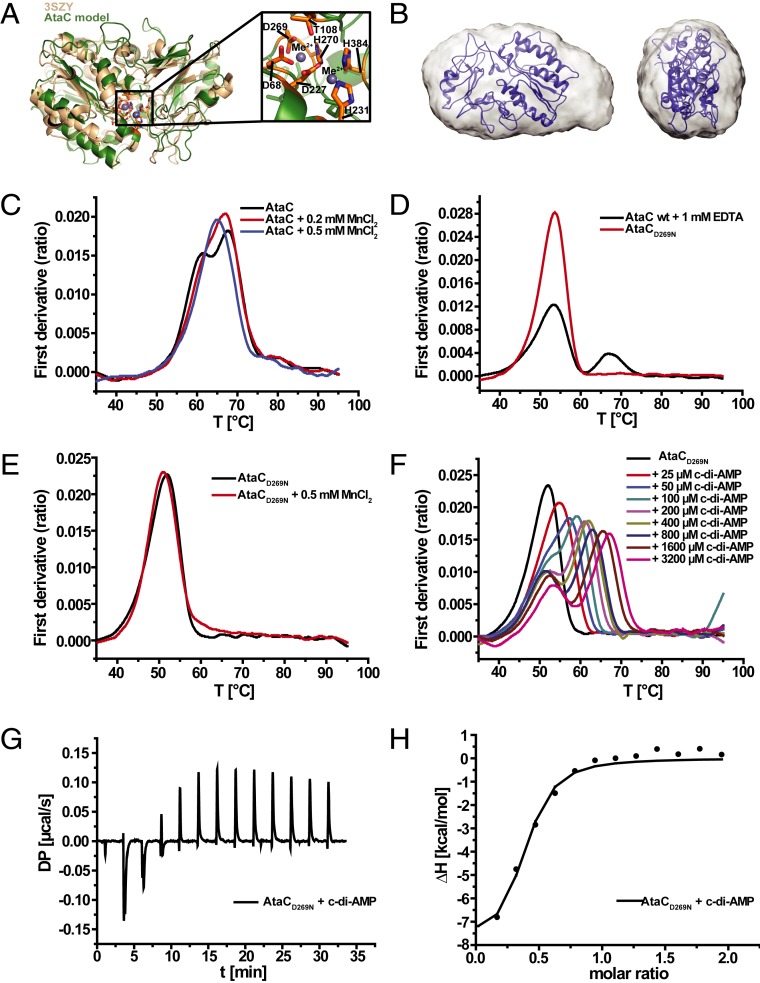
AtaC is a monomeric Mn2+-dependent PDE. (A) Model of AtaC obtained from HHpred/MODELER (green) superimposed with best-match 3SZY (beige). The close-up shows the predicted active site, annotated with all of the most conserved residues. (B) Modeled structure from A superimposed with the final averaged and filtered ab initio shape (16 ab initio models averaged) from SEC-SAXS with the front view (Left) and side view (Right). (C) nanoDSF thermal shift first-derivative curves of 10 µM apo AtaC (black), 10 µM AtaC + 0.2 mM MnCl2 (red), and 10 µM AtaC + 0.5 mM MnCl2 (blue). (D) nanoDSF thermal shift first-derivative curves of 10 µM AtaC + 1 mM EDTA (black) and 10 µM AtaCD269N (red). (E) nanoDSF thermal shift first-derivative curves of 10 µM AtaCD269N (black) and AtaCD269N + 0.5 mM MnCl2 (red). (F) nanoDSF thermal shift first-derivative curves of 10 µM AtaCD269N + c-di-AMP (25 to 3,200 µM). (G) ITC measurement raw data of 23 µM AtaCD269N mutant titrated with 231 µM c-di-AMP. (H) Binding curve and fit of ITC titration of the AtaCD269N mutant with c-di-AMP (KD = 949 ± 360 nM; n = 3).

