Fig. 1.
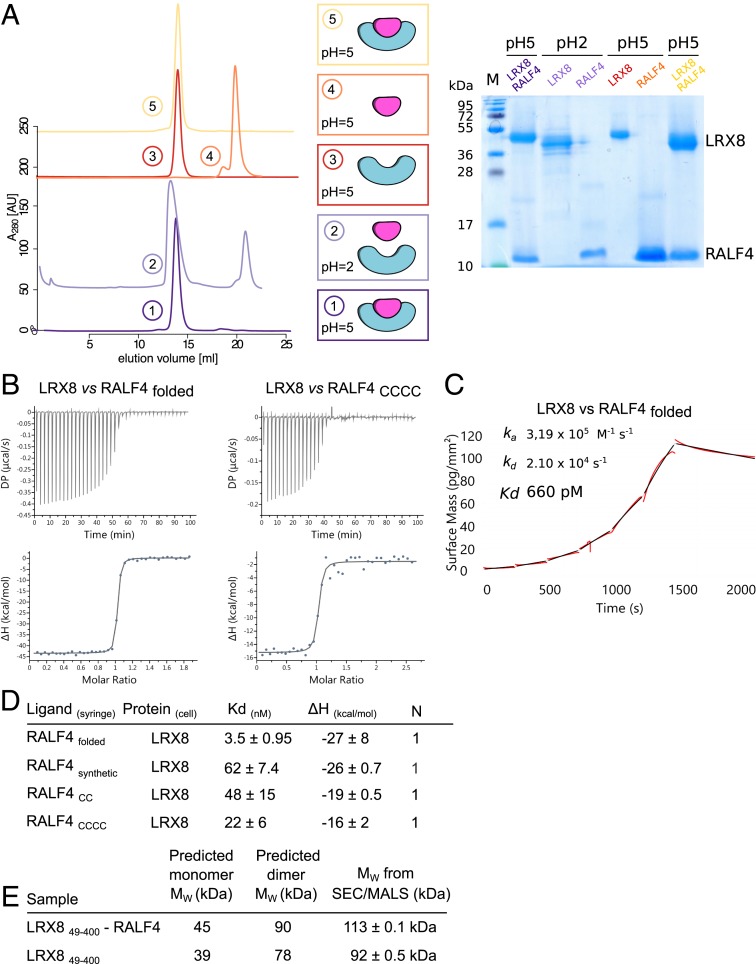
Dimeric LRX proteins bind RALFfolded peptides with high affinity. (A) Folded RALF4 peptide can be obtained by complex dissociation. LRX8–RALF4 complex purification, dissociation, and reconstitution. SEC graphs of the different steps are plotted on the Left. From bottom to top: LRX8–RALF4 purified complex at pH 5.0 (dark purple); dissociated LRX8–RALF4 complex at pH 2.0 (light purple). Orange and red runs represent RALF4 and LRX8 peaks, respectively, dialyzed back to pH 5.0. The SEC for the reconstituted complex, using the previously separated proteins, is shown in yellow. Schematics of the different steps, and SDS gel of the corresponding peaks, are shown alongside. (B) ITC of LRX8 vs. RALF4folded and RALF4CCCC. Raw thermograms of ITC experiments are plotted. (C) Binding kinetics of LRX8 vs. RALF4folded obtained from GCI experiments. The sensogram with recorded data are shown in red with the respective fits in black. The summary table contains the corresponding association rate constant (ka), dissociation rate constant (kd), and the dissociation constant Kd. (D) ITC table summaries of LRX8 vs. RALF4 peptides. Kd, (dissociation constant) indicates the binding affinity between the two molecules considered (in nanomoles). The N indicates the reaction stoichiometry (n = 1 for a 1:1 interaction). The values indicated in the table are the mean ± SD of two or three independent experiments. (E) Table of SEC–MALS analysis of apo–LRX8 and LRX8–RALF4 complex. The predicted and measured values are reported in the table for comparison. Values indicated in the table are the mean ± SD of two or three independent measurements.

