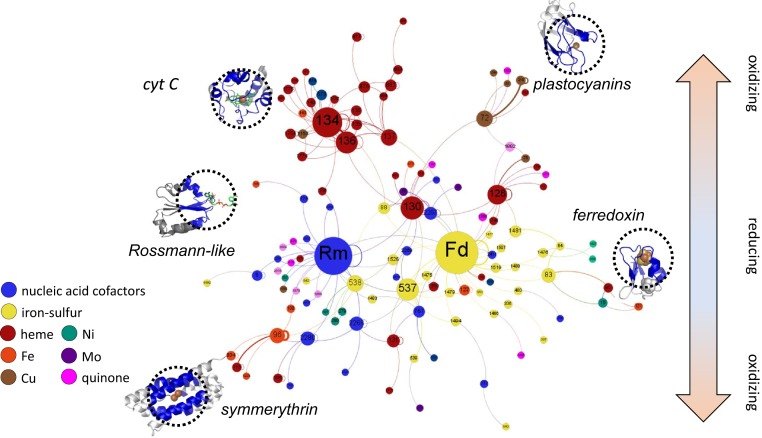
Fig. 1.
SpAN of the EC.1 proteins showing putative electron transfer paths in proteins. Nodes correspond to distinct modules based on structural similarity of microenvironments while the lines connecting nodes (or edges) represent adjacency in the protein. Node size corresponds to the number of electron-transfer–competent connections to other modules. Edge thickness reflects the number of connections in the dataset. Node color represents cofactor type. Examples of protein structures of key modules in the SpAN are shown with the cofactor microenvironment circled. See Dataset S2 for module composition of the SpAN. Rm, module 7; Fd, module 85.

