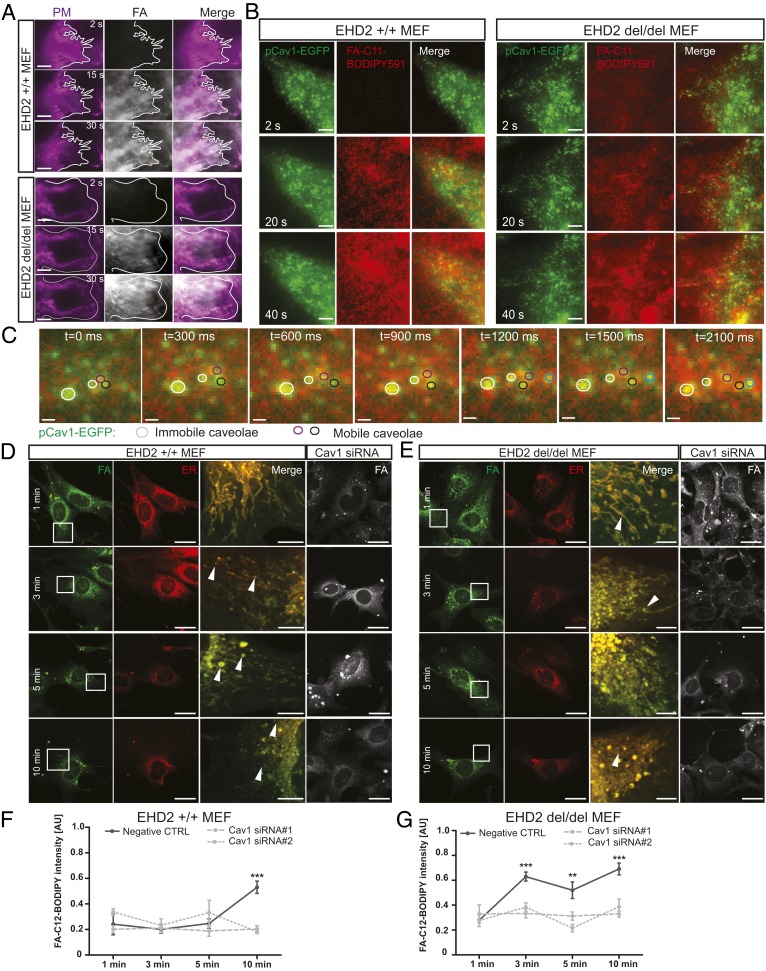
Fig. 6.
Caveolae-related fatty acid uptake and trafficking. (A) Time-resolved C11-BODIPY591 FA accumulation in the plasma membrane of EHD2 +/+ and del/del MEFs was recorded by TIRF. (Scale bars: 1 µm.) Cell borders are indicated. In both genotypes, FAs intercalated into the plasma membrane within seconds, and no qualitative difference between the two genotypes was observed. (B and C) Time-resolved TIRF imaging in MEF expressing Cav1-EGFP treated with C11-BODIPY591 FA. (Scale bars: B, 1 µm.) Detailed caveolae movement in EHD2 del/del MEFs treated with C11-BODIPY591 FA (C, TIRF imaging, mobile caveolae depicted in black, magenta, and blue circles; immobile caveolae in white circles). (Scale bars: 200 nm.) Single images represent sequential acquisition frames of the recording (see also Movies S9 and S10). (D and E) C12-BODIPY FA trafficking in EHD2 +/+ (D) and del/del (E) MEFs treated with Cav1 siRNA (endoplasmic reticulum [ER] stained by ER-TrackerRed). (Scale bars: FA and ER, 20 µm; Merge, 5 µm.) The merged panel illustrates the magnified cell area indicated in the FA panel, and arrowheads indicate LDs. (F and G) Fluorescence intensity of cellular C12-BODIPY FA [+/+: n(Negt CTRL) = 10/3, n(Cav1 si#1) = 12/3, n(Cav1 si#2) = 12/3; del/del: n(Negt CTRL) = 11/3, n(Cav1 si#1) = 12/3, n(Cav1 si#2) = 11/3]. Line graphs indicate mean ± SE. Normal distributed groups were analyzed by t test, and not normally distributed values with Mann–Whitney U test, **P < 0.001, ***P < 0.0001. PM, plasma membrane; AU, arbitrary unit. See also SI Appendix, Fig. S10.

