Fig. 7.
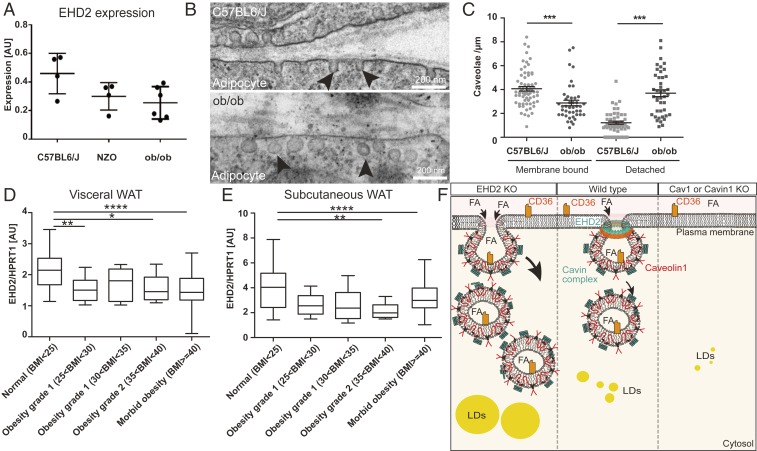
Decreased EHD2 expression in obesity. (A) EHD2 expression level was analyzed in fat tissue of ob/ob or NZO mouse models compared to C57BL6/J mice (n = 5). (B and C) Investigation of caveolae by EM [n(ob/ob mice) = 85/2; n(C57BL6/N) = 117/2]. Black arrowheads indicate caveolae. (D and E) EHD2 expression in visceral (E) or subcutaneous WAT (F) in obese patients [n(normal) = 31; n(overweight) = 23; n(obesity grade 1) = 7; n(obesity grade 2) = 17; n(obesity grade 3) = 202]. (F) The model illustrates how FA uptake is affected by caveolae function. In the absence of caveolae, FA uptake is reduced, resulting in smaller LDs compared to normal conditions. In the absence of EHD2, FA is increased, suggesting a regulatory function of EHD2 in caveolae-dependent lipid uptake. FFA, free fatty acid; LD, lipid droplet. Box plots indicate median with whiskers from maximal to minimum value, or each replicate with mean ± SE is represented. Normal distributed groups were analyzed by t test, and not normally distributed values with Mann–Whitney U test, *P < 0.05, **P < 0.001, ***P < 0.0001, ****P < 0.00001.

