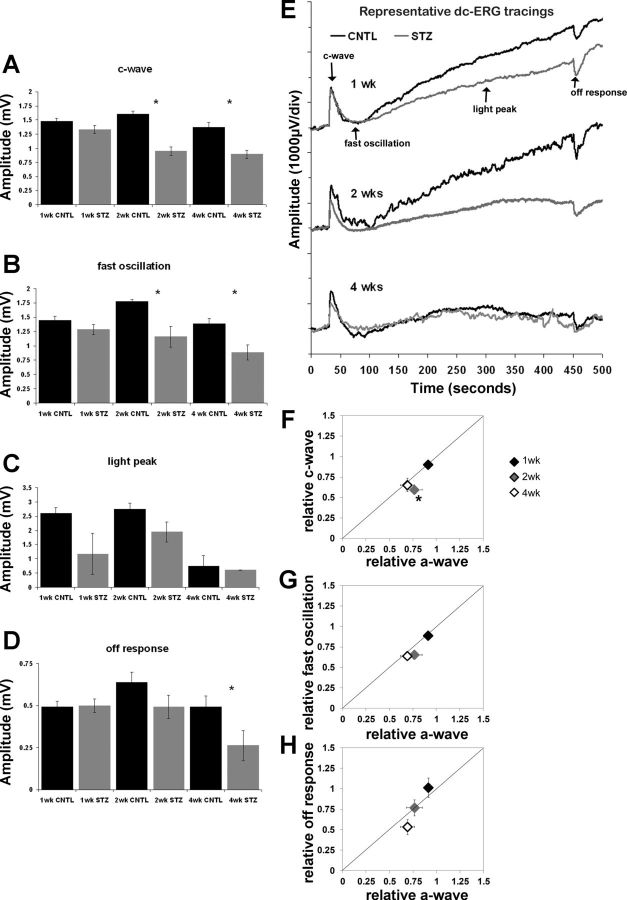
Fig. 2.
T1D STZ mice display reductions in retinal pigment epithelium (RPE) function by the direct current-coupled ERG (dc-ERG), which coincides with decreased photoreceptor function. Bar graphs show c-wave (A), fast oscillation (B), light peak (C), and off response amplitude (D) at the 3 time points tested. Control (CNTL) mice are represented by black bars and STZ-injected diabetic mice by gray bars. E: representative dc-ERG waveform traces at each time point. CNTL traces are shown in black and STZ traces in gray. The major dc-ERG components are labeled in the top trace. F: relative amplitude of the c-wave plotted as a function of the relative a-wave amplitude. G: relative amplitude of the fast oscillation plotted as a function of the relative a-wave amplitude. H: relative amplitude of the off response plotted as a function of the relative a-wave amplitude. Diamonds indicate the number of weeks following onset of hyperglycemia. Statistical analysis was performed separately at each time point between groups; n ≥ 3 for each group at each time point. *P < 0.05.

