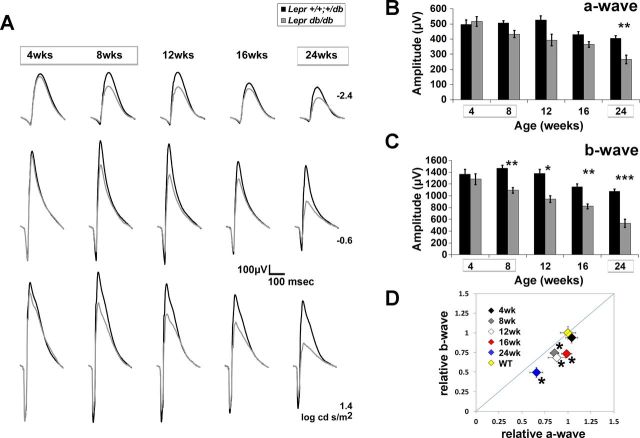
Fig. 6.
T2D B6.BKS.Leprdb/db mice display reductions in a- and b-wave amplitude. A: averaged ERG waveform tracings from 3 representative flash luminances over the time course of testing. B and C: average a-wave and b-wave amplitude at each age in response to a 1.4 log cd·s/m2 flash. Boxes surrounding ages indicate times of hyperglycemia. Results for B6.BKS.Lepr+/+,db/+ mice are shown in black and for Leprdb/db mice in gray. D: amplitude of the b-wave plotted relative to a-wave. Data are normalized to the responses obtained from control B6.BKS.Lepr+/+,db/+ mice at the same time point. The diagonal line indicates an equivalent reduction in a- and b-wave amplitudes. The WT point represents the average relative amplitude ± SE calculated for Lepr+/+,db/+ mice. Diamonds indicate the age of mice at each time point of testing. Data are averages ± SE; n ≥ 8 for each group. Two-way ANOVA with post hoc Tukey's test (B and C) and Student's t-test (D) was performed. *P < 0.05; **P < 0.001; ***P < 0.0001.

