
Fig. 7.
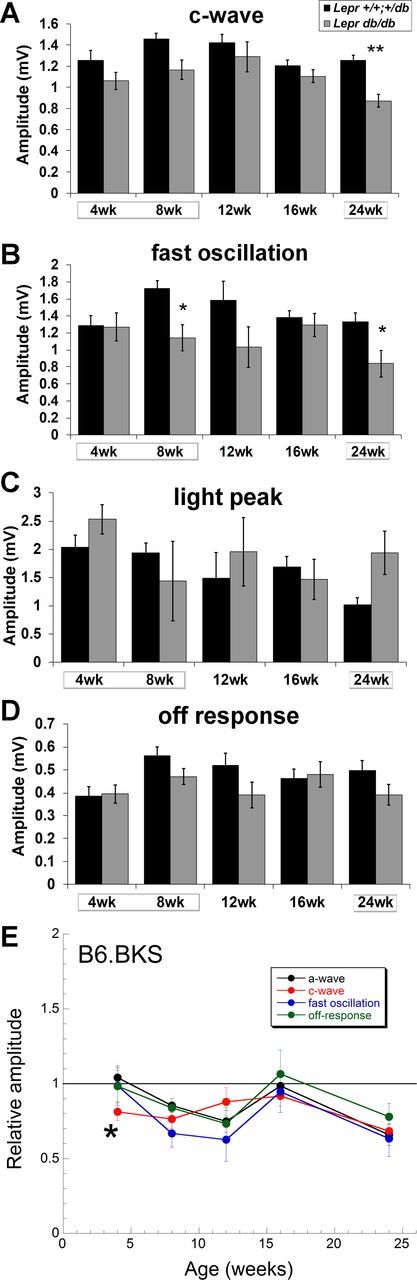
T2D B6.BKS.Leprdb/db mice display reductions in RPE function by the dc-ERG that are largely attributable to decreased photoreceptor activity. Bar graphs show c-wave (A), fast oscillation (B), light peak (C), and off response amplitude (D) of B6.BKS.Lepr+/+,db/+ and B6.BKS.Leprdb/db mice at the ages tested. Results for B6.BKS.Lepr+/+,db/+ mice are shown in black and for Leprdb/db mice in gray. Boxes surrounding ages indicate times of hyperglycemia. E: relative amplitude of the a-wave, c-wave, fast oscillation, and off response in B6.BKS.Leprdb/db mice as a function of age. Data are normalized to responses obtained from B6.BKS.Lepr+/+,db/+ mice; n ≥ 8 for each group. Student's t-test was performed between genotypes at each time point. *P < 0.05; **P < 0.001.