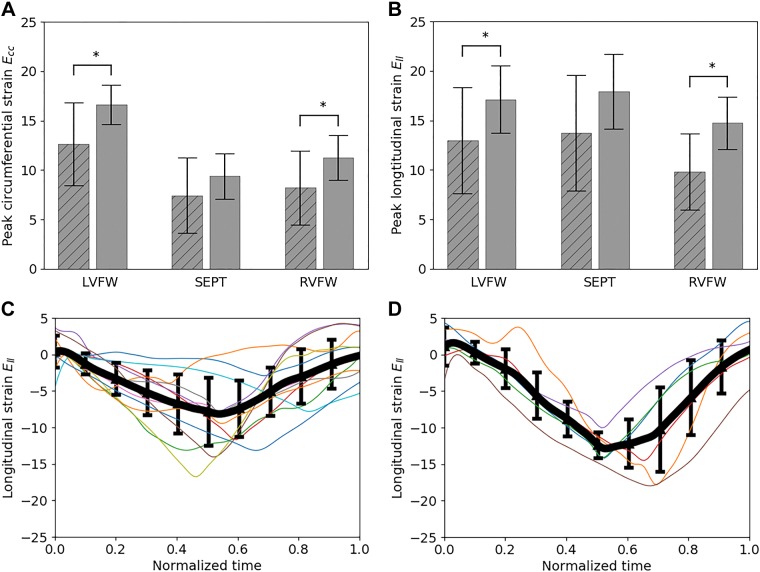
Fig. 1.
Comparison of peak regional circumferential (A) and longitudinal (B) strains between control (unstriped) and pulmonary arterial hypertension (PAH; striped) groups; *P < 0.05, denoting that the latter value is statistically lower than the former. Time traces of right ventricular free wall (RVFW) longitudinal strain of the patients with PAH (C) and control subjects (D). Thick line denotes average, and error bar denotes standard deviation. Ecc, circumferential strain; Ell, longitudinal strain; LVFW, left ventricular free wall; SEPT, septum.

