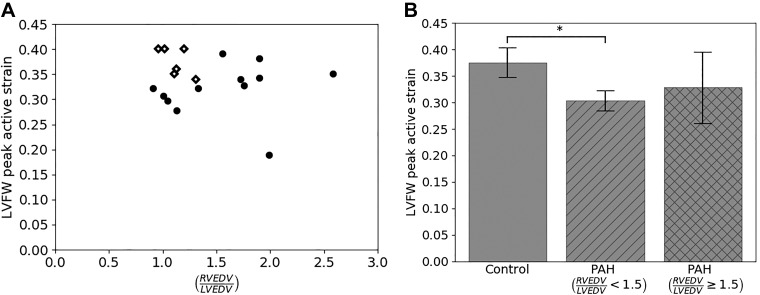
Fig. 6.
Analysis of peak left ventricular free wall (LVFW) contractility γLVFW,max for control and pulmonary arterial hypertension (PAH) groups. A: graphical depiction of peak LVFW contractility for both controls (diamonds) and patients (black dots) as a function of ratio of right ventricular end-diastolic volume to left ventricular end-diastolic volume (RVEDV/LVEDV). B: average γLVFW,max for controls, patients with RVEDV/LVEDV < 1.5, and patients with RVEDV/LVEDV ≥ 1.5. *P < 0.05.

